| Red | Green | Blue | |
| z | 17.64 | ||
| znorm | Inf | ||
| sky | -Inf | -Inf | -Inf |
| S/N | 23.3 | 43.7 | 47.0 |
| S/N(c) | 0.0 | 0.0 | 0.0 |
| SN(E/C) |
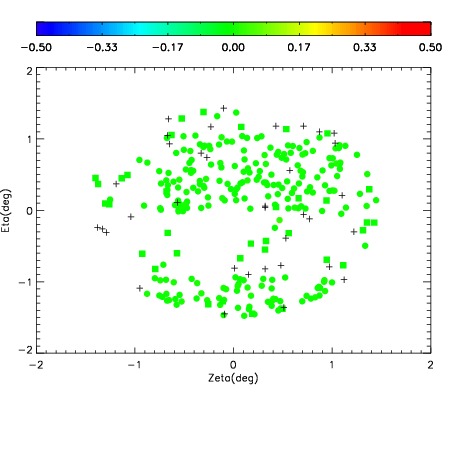
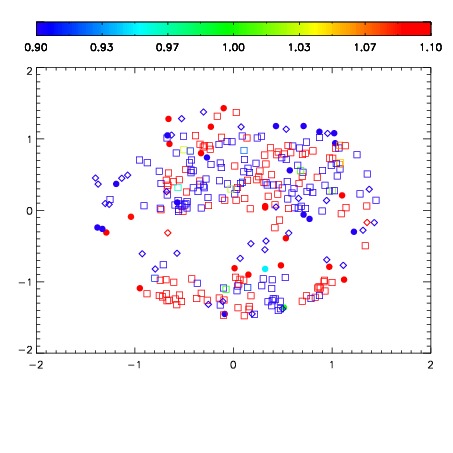


| Frame | Nreads | Zeropoints | Mag plots | Spatial mag deviation | Spatial sky 16325A emission deviations (filled: sky, open: star) | Spatial sky continuum emission | Spatial sky telluric CO2 absorption deviations (filled: H < 10) | |||||||||||||||||||||||
| 0 | 0 |
|
|
|
|
|
|
| IPAIR | NAME | SHIFT | NEWSHIFT | S/N | NAME | SHIFT | NEWSHIFT | S/N |
| 0 | 07630038 | 0.474204 | 0.00000 | 18.8057 | 07630035 | 0.00156417 | 0.472640 | 18.8186 |
| 1 | 07630033 | 0.472425 | 0.00177899 | 18.8895 | 07630032 | 0.00000 | 0.474204 | 18.8423 |
| 2 | 07630034 | 0.473555 | 0.000649005 | 18.7321 | 07630039 | 0.00153975 | 0.472664 | 18.6202 |
| 3 | 07630037 | 0.471921 | 0.00228301 | 18.6009 | 07630036 | -0.00184256 | 0.476047 | 18.5678 |