| Red | Green | Blue | |
| z | 17.64 | ||
| znorm | Inf | ||
| sky | -Inf | -Inf | -Inf |
| S/N | 12.7 | 26.3 | 27.4 |
| S/N(c) | 0.0 | 0.0 | 0.0 |
| SN(E/C) |
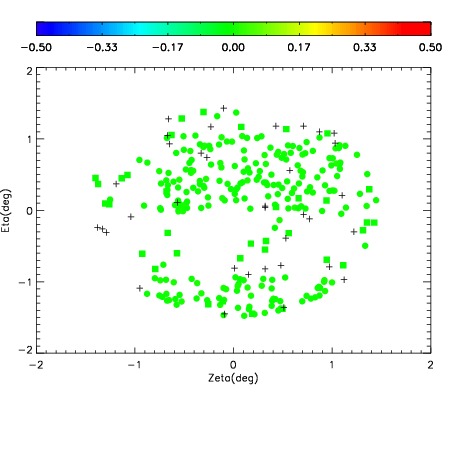

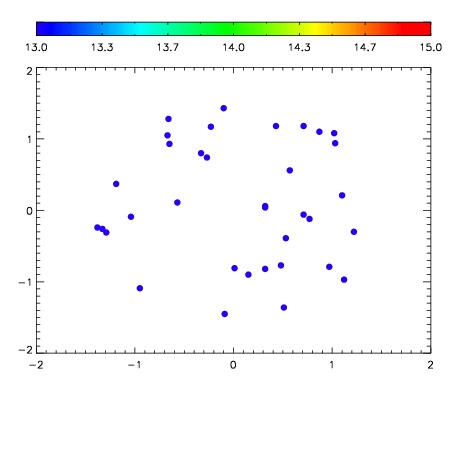

| Frame | Nreads | Zeropoints | Mag plots | Spatial mag deviation | Spatial sky 16325A emission deviations (filled: sky, open: star) | Spatial sky continuum emission | Spatial sky telluric CO2 absorption deviations (filled: H < 10) | |||||||||||||||||||||||
| 0 | 0 |
|
|
|
|
|
|
| IPAIR | NAME | SHIFT | NEWSHIFT | S/N | NAME | SHIFT | NEWSHIFT | S/N |
| 0 | 07840048 | 0.480526 | 0.00000 | 17.8537 | 07840046 | 0.00372726 | 0.476799 | 17.9946 |
| 1 | 07840044 | 0.477936 | 0.00259000 | 17.8788 | 07840042 | 0.00000 | 0.480526 | 18.0067 |
| 2 | 07840047 | 0.480416 | 0.000110000 | 17.8358 | 07840049 | 0.00985214 | 0.470674 | 17.7855 |
| 3 | 07840043 | 0.476636 | 0.00389001 | 17.7652 | 07840045 | 0.00144441 | 0.479082 | 17.7464 |