| Red | Green | Blue | |
| z | 17.64 | ||
| znorm | Inf | ||
| sky | -Inf | -Inf | -Inf |
| S/N | 25.9 | 46.7 | 51.2 |
| S/N(c) | 0.0 | 0.0 | 0.0 |
| SN(E/C) |

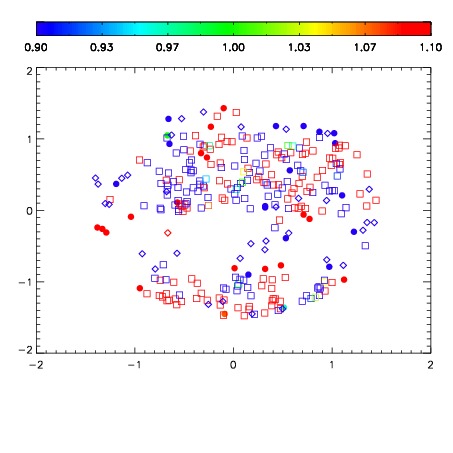


| Frame | Nreads | Zeropoints | Mag plots | Spatial mag deviation | Spatial sky 16325A emission deviations (filled: sky, open: star) | Spatial sky continuum emission | Spatial sky telluric CO2 absorption deviations (filled: H < 10) | |||||||||||||||||||||||
| 0 | 0 |
|
|
|
|
|
|
| IPAIR | NAME | SHIFT | NEWSHIFT | S/N | NAME | SHIFT | NEWSHIFT | S/N |
| 0 | 07850065 | 0.483878 | 0.00000 | 18.8214 | 07850063 | 0.00339543 | 0.480483 | 18.7433 |
| 1 | 07850061 | 0.480055 | 0.00382298 | 18.8419 | 07850059 | 0.00000 | 0.483878 | 18.8261 |
| 2 | 07850064 | 0.482829 | 0.00104898 | 18.8406 | 07850062 | 0.00170329 | 0.482175 | 18.8051 |
| 3 | 07850060 | 0.478919 | 0.00495899 | 18.8379 | 07850066 | 0.00797028 | 0.475908 | 18.8029 |