| Red | Green | Blue | |
| z | 17.64 | ||
| znorm | Inf | ||
| sky | -NaN | -NaN | -Inf |
| S/N | 15.8 | 28.8 | 32.7 |
| S/N(c) | 0.0 | 0.0 | 0.0 |
| SN(E/C) |
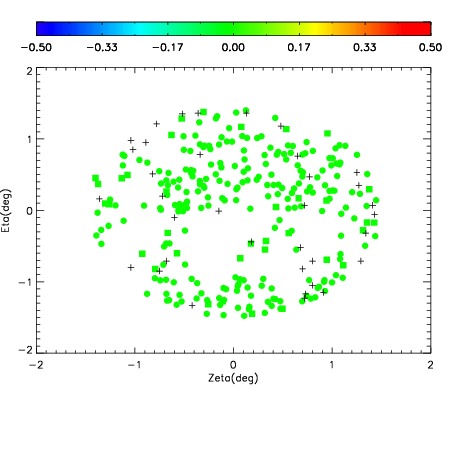
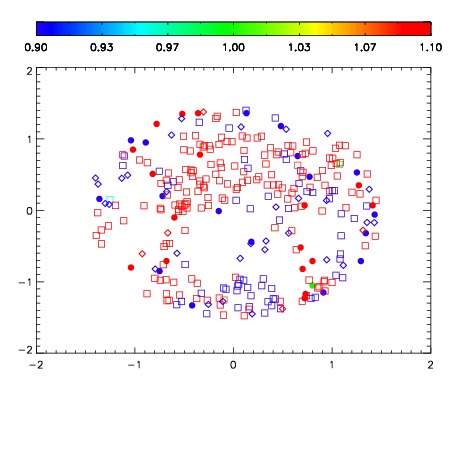
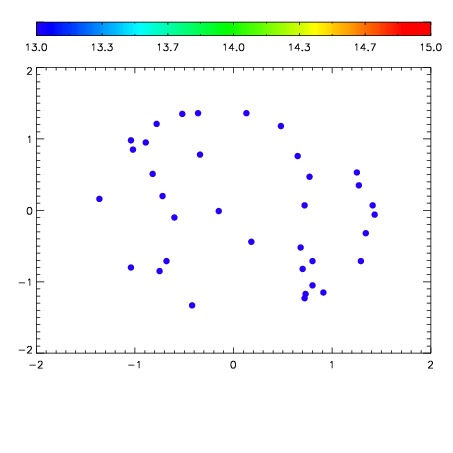

| Frame | Nreads | Zeropoints | Mag plots | Spatial mag deviation | Spatial sky 16325A emission deviations (filled: sky, open: star) | Spatial sky continuum emission | Spatial sky telluric CO2 absorption deviations (filled: H < 10) | |||||||||||||||||||||||
| 0 | 0 |
|
|
|
|
|
|
| IPAIR | NAME | SHIFT | NEWSHIFT | S/N | NAME | SHIFT | NEWSHIFT | S/N |
| 0 | 07900043 | 0.469287 | 0.00000 | 18.6843 | 07900041 | 0.00173287 | 0.467554 | 18.4958 |
| 1 | 07900042 | 0.467965 | 0.00132200 | 18.6962 | 07900044 | 0.00340822 | 0.465879 | 18.7044 |
| 2 | 07900039 | 0.468926 | 0.000360996 | 18.2542 | 07900040 | 0.000996012 | 0.468291 | 18.1929 |
| 3 | 07900038 | 0.466383 | 0.00290400 | 18.0494 | 07900037 | 0.00000 | 0.469287 | 17.8503 |