| Red | Green | Blue | |
| z | 17.64 | ||
| znorm | Inf | ||
| sky | -Inf | -Inf | -NaN |
| S/N | 25.9 | 42.9 | 47.8 |
| S/N(c) | 0.0 | 0.0 | 0.0 |
| SN(E/C) |
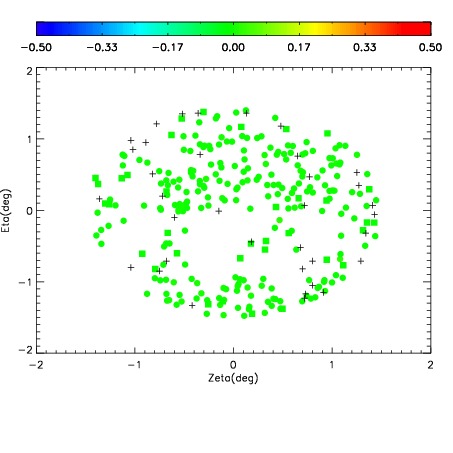
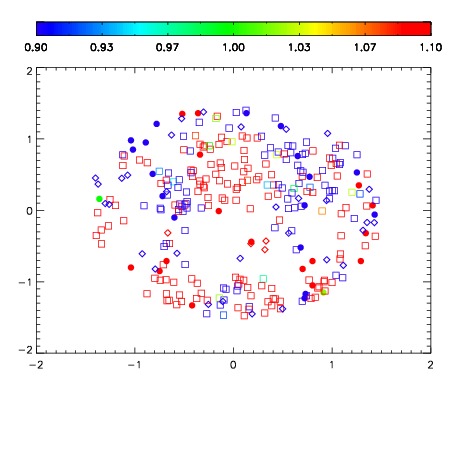
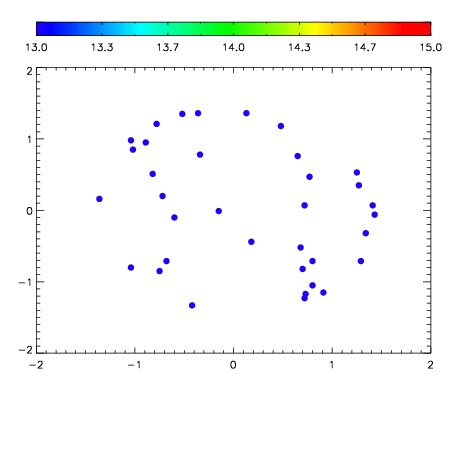

| Frame | Nreads | Zeropoints | Mag plots | Spatial mag deviation | Spatial sky 16325A emission deviations (filled: sky, open: star) | Spatial sky continuum emission | Spatial sky telluric CO2 absorption deviations (filled: H < 10) | |||||||||||||||||||||||
| 0 | 0 |
|
|
|
|
|
|
| IPAIR | NAME | SHIFT | NEWSHIFT | S/N | NAME | SHIFT | NEWSHIFT | S/N |
| 0 | 08190031 | 0.512947 | 0.00000 | 19.1263 | 08190025 | 0.00000 | 0.512947 | 19.1356 |
| 1 | 08190026 | 0.507809 | 0.00513804 | 19.0740 | 08190032 | 0.00436509 | 0.508582 | 19.1189 |
| 2 | 08190027 | 0.512491 | 0.000456035 | 18.9423 | 08190028 | 0.00331060 | 0.509636 | 18.9086 |
| 3 | 08190030 | 0.510771 | 0.00217605 | 18.8404 | 08190029 | 0.00192235 | 0.511025 | 18.7000 |