| Red | Green | Blue | |
| z | 17.64 | ||
| znorm | Inf | ||
| sky | -NaN | -Inf | -Inf |
| S/N | 27.6 | 45.7 | 49.9 |
| S/N(c) | 0.0 | 0.0 | 0.0 |
| SN(E/C) |
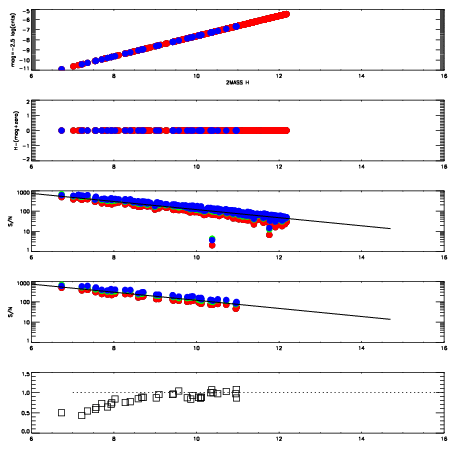
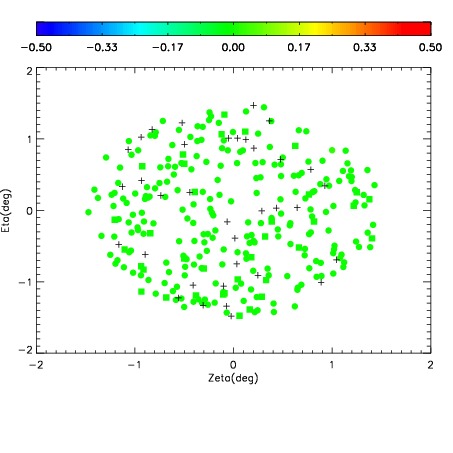
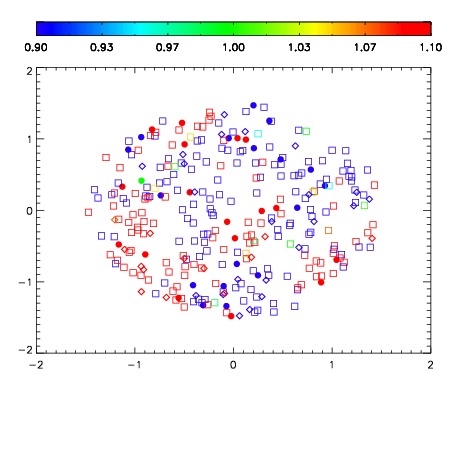
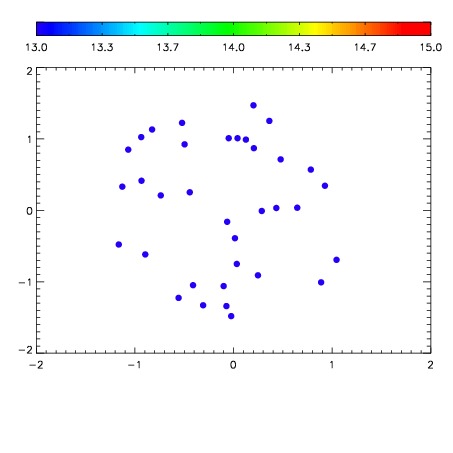

| Frame | Nreads | Zeropoints | Mag plots | Spatial mag deviation | Spatial sky 16325A emission deviations (filled: sky, open: star) | Spatial sky continuum emission | Spatial sky telluric CO2 absorption deviations (filled: H < 10) | |||||||||||||||||||||||
| 0 | 0 |
|
|
|
|
|
|
| IPAIR | NAME | SHIFT | NEWSHIFT | S/N | NAME | SHIFT | NEWSHIFT | S/N |
| 0 | 03650017 | 0.510945 | 0.00000 | 19.0555 | 03650022 | 0.00417059 | 0.506774 | 19.0675 |
| 1 | 03650020 | 0.509713 | 0.00123203 | 19.0788 | 03650018 | 0.00104370 | 0.509901 | 19.0954 |
| 2 | 03650021 | 0.509371 | 0.00157404 | 19.0511 | 03650019 | 0.000838128 | 0.510107 | 19.0475 |
| 3 | 03650016 | 0.508023 | 0.00292200 | 19.0168 | 03650015 | 0.00000 | 0.510945 | 18.9865 |