| Red | Green | Blue | |
| z | 17.64 | ||
| znorm | Inf | ||
| sky | -Inf | -Inf | -Inf |
| S/N | 24.5 | 40.9 | 43.9 |
| S/N(c) | 0.0 | 0.0 | 0.0 |
| SN(E/C) |
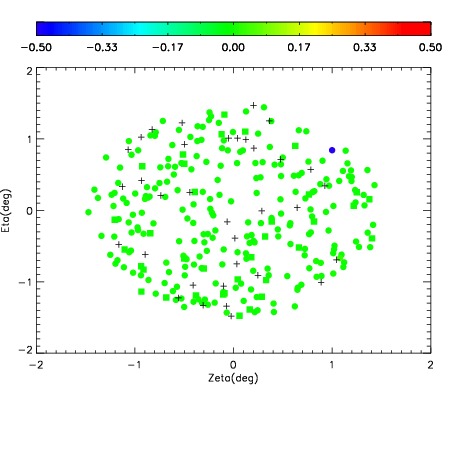
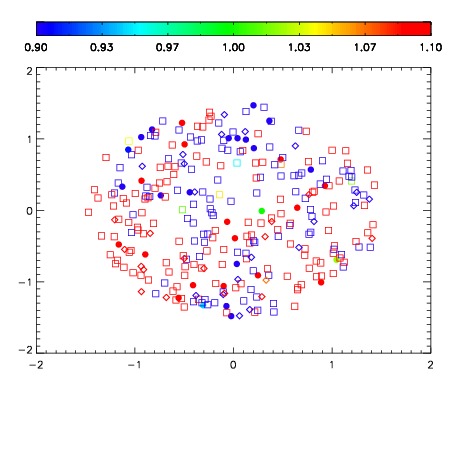
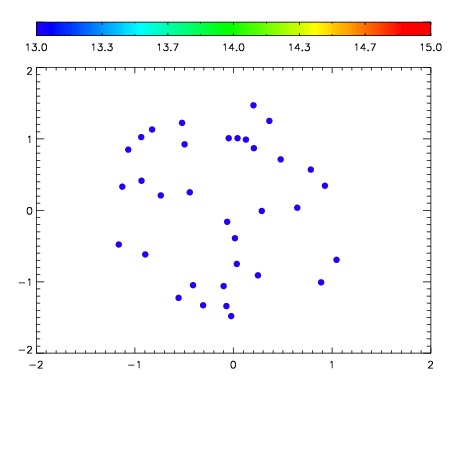

| Frame | Nreads | Zeropoints | Mag plots | Spatial mag deviation | Spatial sky 16325A emission deviations (filled: sky, open: star) | Spatial sky continuum emission | Spatial sky telluric CO2 absorption deviations (filled: H < 10) | |||||||||||||||||||||||
| 0 | 0 |
|
|
|
|
|
|
| IPAIR | NAME | SHIFT | NEWSHIFT | S/N | NAME | SHIFT | NEWSHIFT | S/N |
| 0 | 03690014 | 0.502035 | 0.00000 | 18.9757 | 03690012 | 0.00290403 | 0.499131 | 18.9552 |
| 1 | 03690013 | 0.498755 | 0.00328001 | 18.9695 | 03690015 | 0.00383937 | 0.498196 | 18.9405 |
| 2 | 03690010 | 0.498646 | 0.00338903 | 18.8084 | 03690011 | 0.00477773 | 0.497257 | 18.9252 |
| 3 | 03690009 | 0.497649 | 0.00438601 | 18.7823 | 03690008 | 0.00000 | 0.502035 | 18.8990 |