| Red | Green | Blue | |
| z | 17.64 | ||
| znorm | Inf | ||
| sky | -NaN | -Inf | -NaN |
| S/N | 19.9 | 34.1 | 35.6 |
| S/N(c) | 0.0 | 0.0 | 0.0 |
| SN(E/C) |
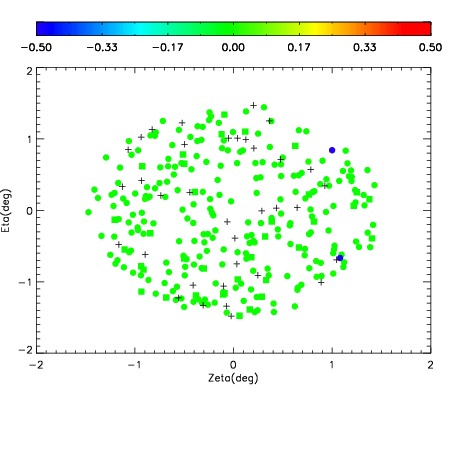

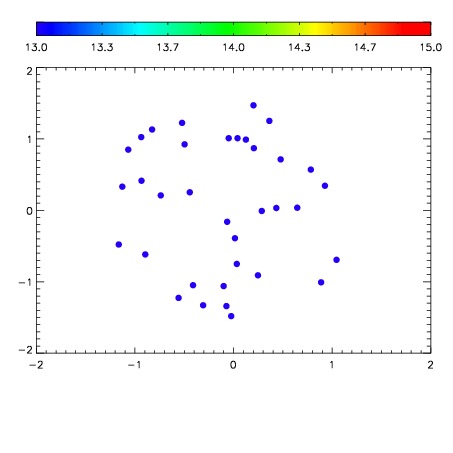

| Frame | Nreads | Zeropoints | Mag plots | Spatial mag deviation | Spatial sky 16325A emission deviations (filled: sky, open: star) | Spatial sky continuum emission | Spatial sky telluric CO2 absorption deviations (filled: H < 10) | |||||||||||||||||||||||
| 0 | 0 |
|
|
|
|
|
|
| IPAIR | NAME | SHIFT | NEWSHIFT | S/N | NAME | SHIFT | NEWSHIFT | S/N |
| 0 | 06720023 | 0.481057 | 0.00000 | 18.5775 | 06720028 | -0.000103164 | 0.481160 | 18.4328 |
| 1 | 06720027 | 0.480505 | 0.000551999 | 18.7239 | 06720024 | -0.00200640 | 0.483063 | 18.8972 |
| 2 | 06720026 | 0.478352 | 0.00270498 | 18.7061 | 06720021 | 0.00000 | 0.481057 | 18.7048 |
| 3 | 06720022 | 0.478878 | 0.00217900 | 18.2783 | 06720025 | -0.00491285 | 0.485970 | 18.1913 |