| Red | Green | Blue | |
| z | 17.64 | ||
| znorm | Inf | ||
| sky | -NaN | -NaN | -Inf |
| S/N | 19.4 | 35.1 | 36.7 |
| S/N(c) | 0.0 | 0.0 | 0.0 |
| SN(E/C) |
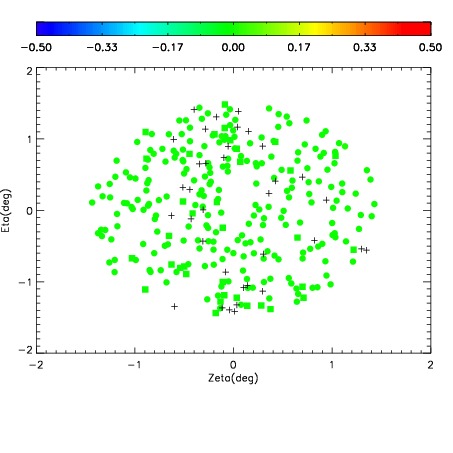

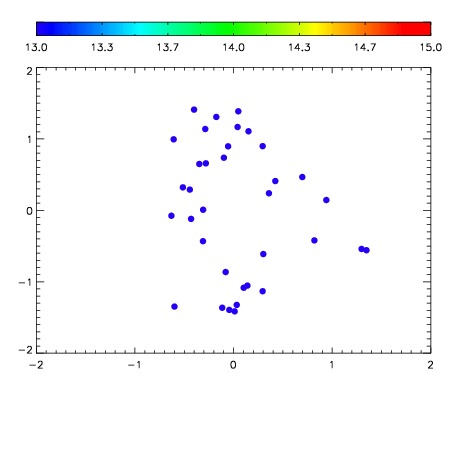

| Frame | Nreads | Zeropoints | Mag plots | Spatial mag deviation | Spatial sky 16325A emission deviations (filled: sky, open: star) | Spatial sky continuum emission | Spatial sky telluric CO2 absorption deviations (filled: H < 10) | |||||||||||||||||||||||
| 0 | 0 |
|
|
|
|
|
|
| IPAIR | NAME | SHIFT | NEWSHIFT | S/N | NAME | SHIFT | NEWSHIFT | S/N |
| 0 | 07290012 | 0.485085 | 0.00000 | 18.3773 | 07290014 | 0.00153252 | 0.483552 | 18.3862 |
| 1 | 07290017 | 0.485046 | 3.90112e-05 | 18.6247 | 07290011 | 0.00000 | 0.485085 | 18.7294 |
| 2 | 07290016 | 0.484888 | 0.000197023 | 18.5826 | 07290018 | 0.00395122 | 0.481134 | 18.6319 |
| 3 | 07290013 | 0.485054 | 3.10242e-05 | 18.2864 | 07290015 | 0.00234713 | 0.482738 | 18.2276 |