| Red | Green | Blue | |
| z | 17.64 | ||
| znorm | Inf | ||
| sky | -Inf | -NaN | -Inf |
| S/N | 31.7 | 51.9 | 55.0 |
| S/N(c) | 0.0 | 0.0 | 0.0 |
| SN(E/C) |
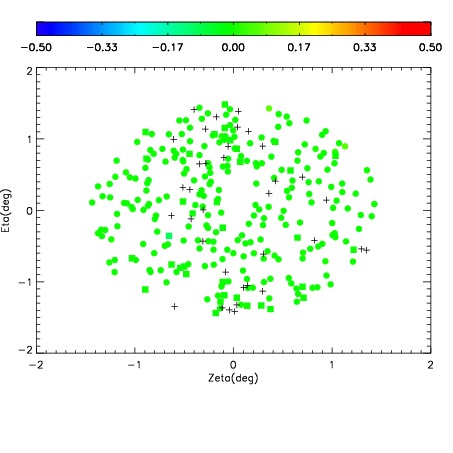
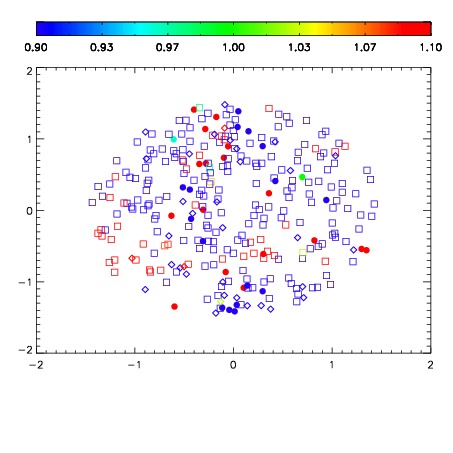


| Frame | Nreads | Zeropoints | Mag plots | Spatial mag deviation | Spatial sky 16325A emission deviations (filled: sky, open: star) | Spatial sky continuum emission | Spatial sky telluric CO2 absorption deviations (filled: H < 10) | |||||||||||||||||||||||
| 0 | 0 |
|
|
|
|
|
|
| IPAIR | NAME | SHIFT | NEWSHIFT | S/N | NAME | SHIFT | NEWSHIFT | S/N |
| 0 | 09720038 | 0.517938 | 0.00000 | 19.1558 | 09720039 | 0.00416396 | 0.513774 | 19.1788 |
| 1 | 09720041 | 0.516825 | 0.00111300 | 19.2548 | 09720036 | 0.00000 | 0.517938 | 19.2477 |
| 2 | 09720042 | 0.516276 | 0.00166202 | 19.2533 | 09720040 | 0.00376004 | 0.514178 | 19.2277 |
| 3 | 09720037 | 0.517012 | 0.000926018 | 19.2479 | 09720043 | 0.00450233 | 0.513436 | 19.2062 |