| Red | Green | Blue | |
| z | 17.64 | ||
| znorm | Inf | ||
| sky | -Inf | -Inf | -Inf |
| S/N | 29.2 | 48.4 | 51.2 |
| S/N(c) | 0.0 | 0.0 | 0.0 |
| SN(E/C) |
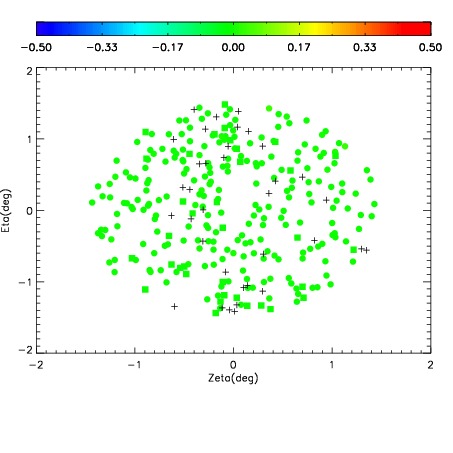
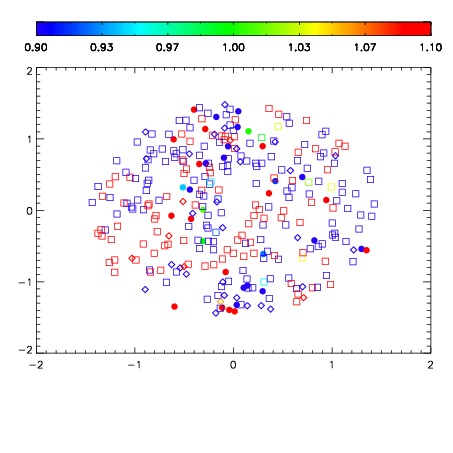


| Frame | Nreads | Zeropoints | Mag plots | Spatial mag deviation | Spatial sky 16325A emission deviations (filled: sky, open: star) | Spatial sky continuum emission | Spatial sky telluric CO2 absorption deviations (filled: H < 10) | |||||||||||||||||||||||
| 0 | 0 |
|
|
|
|
|
|
| IPAIR | NAME | SHIFT | NEWSHIFT | S/N | NAME | SHIFT | NEWSHIFT | S/N |
| 0 | 09970061 | 0.519939 | 0.00000 | 19.0427 | 09970059 | 0.00203559 | 0.517903 | 19.0920 |
| 1 | 09970057 | 0.519081 | 0.000858009 | 19.1061 | 09970058 | 0.00177989 | 0.518159 | 19.1306 |
| 2 | 09970056 | 0.519308 | 0.000631034 | 19.1029 | 09970062 | -0.000122816 | 0.520062 | 19.1125 |
| 3 | 09970060 | 0.519818 | 0.000120997 | 19.0454 | 09970055 | 0.00000 | 0.519939 | 19.1089 |