| Red | Green | Blue | |
| z | 17.64 | ||
| znorm | Inf | ||
| sky | -Inf | -Inf | -Inf |
| S/N | 23.4 | 39.6 | 43.5 |
| S/N(c) | 0.0 | 0.0 | 0.0 |
| SN(E/C) |
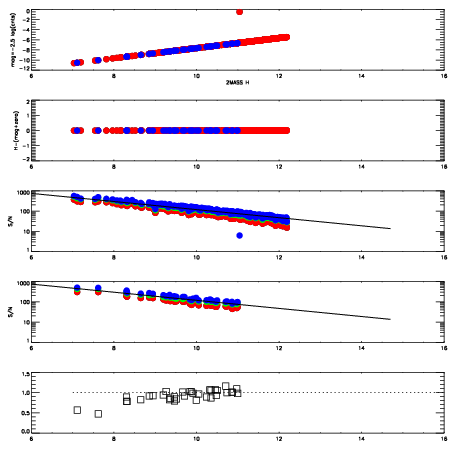
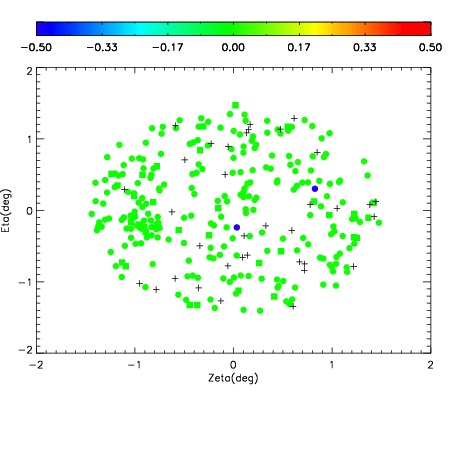
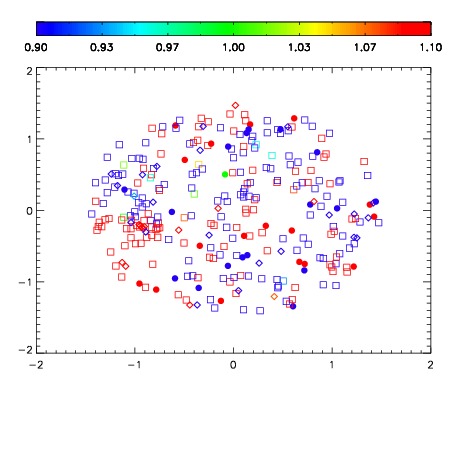
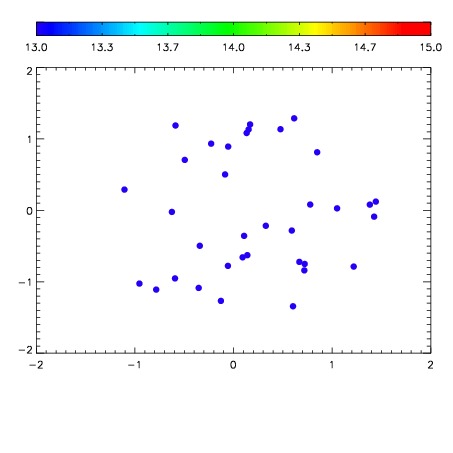

| Frame | Nreads | Zeropoints | Mag plots | Spatial mag deviation | Spatial sky 16325A emission deviations (filled: sky, open: star) | Spatial sky continuum emission | Spatial sky telluric CO2 absorption deviations (filled: H < 10) | |||||||||||||||||||||||
| 0 | 0 |
|
|
|
|
|
|
| IPAIR | NAME | SHIFT | NEWSHIFT | S/N | NAME | SHIFT | NEWSHIFT | S/N |
| 0 | 06980032 | 0.483389 | 0.00000 | 18.5926 | 06980030 | 0.00223365 | 0.481155 | 18.7809 |
| 1 | 06980027 | 0.481109 | 0.00228000 | 19.0826 | 06980026 | 0.00000 | 0.483389 | 19.0613 |
| 2 | 06980028 | 0.482055 | 0.00133398 | 18.9392 | 06980033 | 0.00283850 | 0.480550 | 19.0032 |
| 3 | 06980031 | 0.482224 | 0.00116500 | 18.6943 | 06980029 | 0.00346058 | 0.479928 | 18.7933 |