| Red | Green | Blue | |
| z | 17.64 | ||
| znorm | Inf | ||
| sky | -Inf | -Inf | -Inf |
| S/N | 19.2 | 33.7 | 35.8 |
| S/N(c) | 0.0 | 0.0 | 0.0 |
| SN(E/C) |
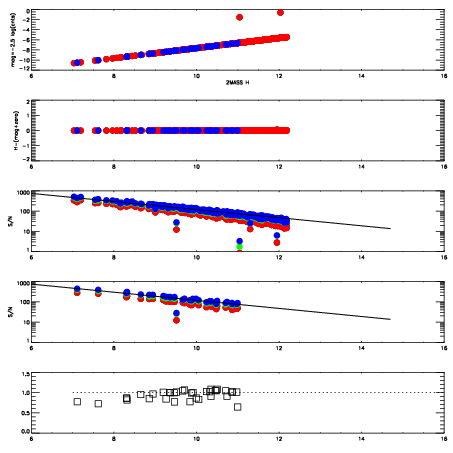


| Frame | Nreads | Zeropoints | Mag plots | Spatial mag deviation | Spatial sky 16325A emission deviations (filled: sky, open: star) | Spatial sky continuum emission | Spatial sky telluric CO2 absorption deviations (filled: H < 10) | |||||||||||||||||||||||
| 0 | 0 |
|
|
|
|
|
|
| IPAIR | NAME | SHIFT | NEWSHIFT | S/N | NAME | SHIFT | NEWSHIFT | S/N |
| 0 | 07210017 | 0.486175 | 0.00000 | 18.8816 | 07210018 | 0.00550257 | 0.480672 | 18.8237 |
| 1 | 07210016 | 0.485653 | 0.000521988 | 18.8229 | 07210015 | 0.00625630 | 0.479919 | 18.6680 |
| 2 | 07210013 | 0.484186 | 0.00198901 | 18.6750 | 07210014 | 0.00707715 | 0.479098 | 18.5618 |
| 3 | 07210012 | 0.483600 | 0.00257501 | 18.2313 | 07210011 | 0.00000 | 0.486175 | 17.7737 |