| Red | Green | Blue | |
| z | 17.64 | ||
| znorm | Inf | ||
| sky | -Inf | -Inf | -Inf |
| S/N | 13.9 | 24.4 | 26.5 |
| S/N(c) | 0.0 | 0.0 | 0.0 |
| SN(E/C) |
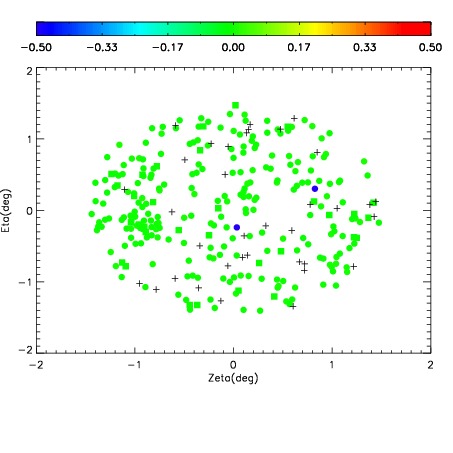
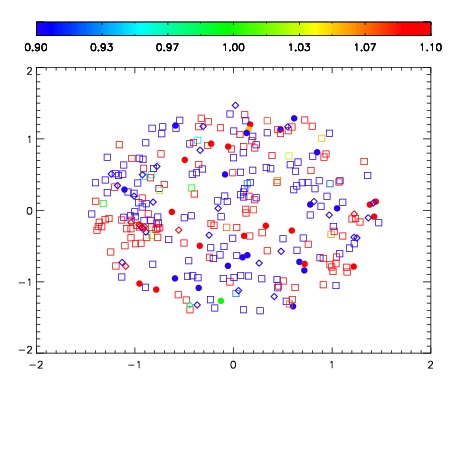
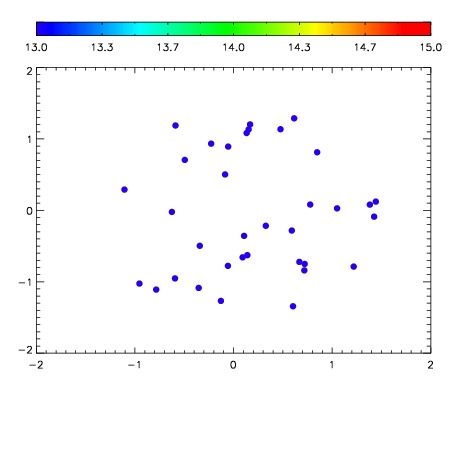

| Frame | Nreads | Zeropoints | Mag plots | Spatial mag deviation | Spatial sky 16325A emission deviations (filled: sky, open: star) | Spatial sky continuum emission | Spatial sky telluric CO2 absorption deviations (filled: H < 10) | |||||||||||||||||||||||
| 0 | 0 |
|
|
|
|
|
|
| IPAIR | NAME | SHIFT | NEWSHIFT | S/N | NAME | SHIFT | NEWSHIFT | S/N |
| 0 | 07260018 | 0.481867 | 0.00000 | 18.2343 | 07260016 | 0.00197967 | 0.479887 | 18.3518 |
| 1 | 07260017 | 0.481548 | 0.000318974 | 18.3074 | 07260012 | 0.00000 | 0.481867 | 18.6712 |
| 2 | 07260013 | 0.477284 | 0.00458297 | 17.7057 | 07260015 | 0.00261366 | 0.479253 | 18.0056 |
| 3 | 07260014 | 0.477321 | 0.00454599 | 17.5457 | 07260019 | 0.00265419 | 0.479213 | 17.5982 |