| Red | Green | Blue | |
| z | 17.64 | ||
| znorm | Inf | ||
| sky | -Inf | -Inf | -Inf |
| S/N | 24.4 | 42.4 | 45.5 |
| S/N(c) | 0.0 | 0.0 | 0.0 |
| SN(E/C) |


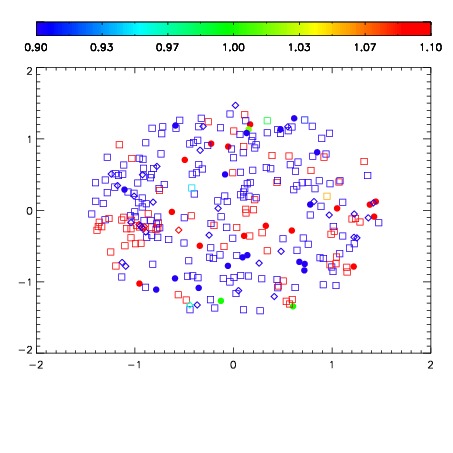


| Frame | Nreads | Zeropoints | Mag plots | Spatial mag deviation | Spatial sky 16325A emission deviations (filled: sky, open: star) | Spatial sky continuum emission | Spatial sky telluric CO2 absorption deviations (filled: H < 10) | |||||||||||||||||||||||
| 0 | 0 |
|
|
|
|
|
|
| IPAIR | NAME | SHIFT | NEWSHIFT | S/N | NAME | SHIFT | NEWSHIFT | S/N |
| 0 | 07280013 | 0.485753 | 0.00000 | 18.8646 | 07280011 | 0.00000 | 0.485753 | 18.8691 |
| 1 | 07280017 | 0.484057 | 0.00169599 | 18.9641 | 07280018 | 0.000451258 | 0.485302 | 18.9931 |
| 2 | 07280016 | 0.483053 | 0.00270000 | 18.9332 | 07280015 | -3.89449e-05 | 0.485792 | 18.9183 |
| 3 | 07280012 | 0.485304 | 0.000449002 | 18.8984 | 07280014 | -5.78261e-05 | 0.485811 | 18.8914 |