| Red | Green | Blue | |
| z | 17.64 | ||
| znorm | Inf | ||
| sky | -Inf | -Inf | -Inf |
| S/N | 26.6 | 45.7 | 47.8 |
| S/N(c) | 0.0 | 0.0 | 0.0 |
| SN(E/C) |
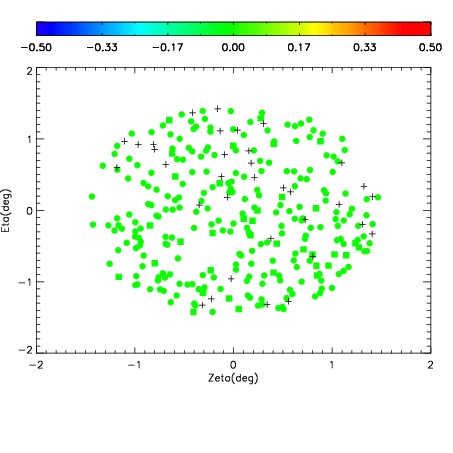
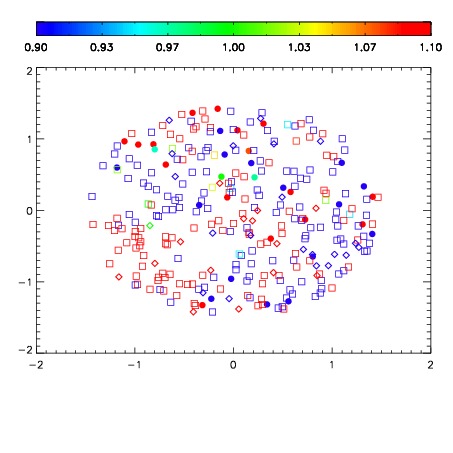
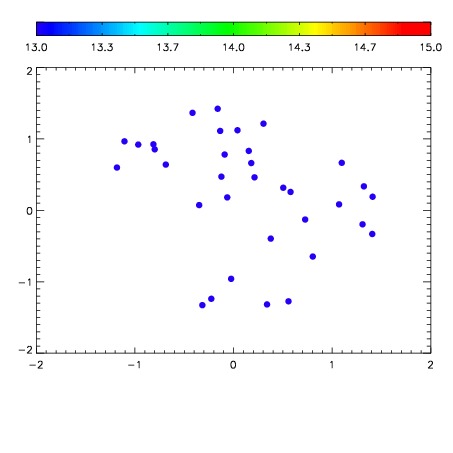

| Frame | Nreads | Zeropoints | Mag plots | Spatial mag deviation | Spatial sky 16325A emission deviations (filled: sky, open: star) | Spatial sky continuum emission | Spatial sky telluric CO2 absorption deviations (filled: H < 10) | |||||||||||||||||||||||
| 0 | 0 |
|
|
|
|
|
|
| IPAIR | NAME | SHIFT | NEWSHIFT | S/N | NAME | SHIFT | NEWSHIFT | S/N |
| 0 | 03710012 | 0.498155 | 0.00000 | 19.1018 | 03710010 | 0.00000 | 0.498155 | 19.1109 |
| 1 | 03710016 | 0.496582 | 0.00157300 | 19.1646 | 03710017 | -0.00173613 | 0.499891 | 19.1837 |
| 2 | 03710015 | 0.492783 | 0.00537199 | 19.1406 | 03710014 | -0.00375825 | 0.501913 | 19.1257 |
| 3 | 03710011 | 0.491401 | 0.00675401 | 19.1074 | 03710013 | 0.000369896 | 0.497785 | 19.1223 |