| Red | Green | Blue | |
| z | 17.64 | ||
| znorm | Inf | ||
| sky | -NaN | -NaN | -Inf |
| S/N | 24.7 | 43.5 | 44.5 |
| S/N(c) | 0.0 | 0.0 | 0.0 |
| SN(E/C) |
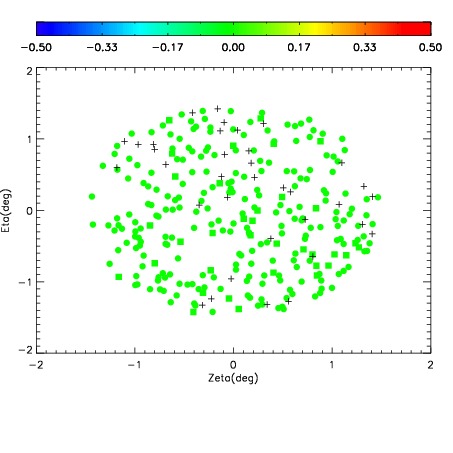
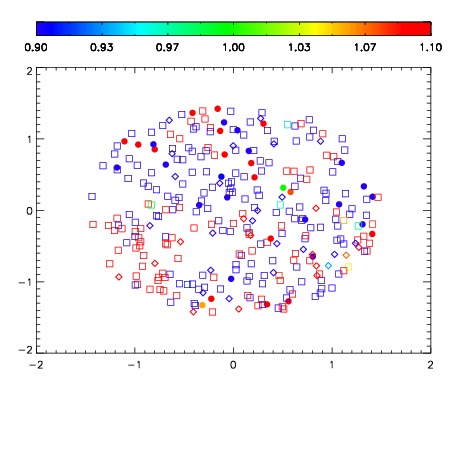


| Frame | Nreads | Zeropoints | Mag plots | Spatial mag deviation | Spatial sky 16325A emission deviations (filled: sky, open: star) | Spatial sky continuum emission | Spatial sky telluric CO2 absorption deviations (filled: H < 10) | |||||||||||||||||||||||
| 0 | 0 |
|
|
|
|
|
|
| IPAIR | NAME | SHIFT | NEWSHIFT | S/N | NAME | SHIFT | NEWSHIFT | S/N |
| 0 | 09970068 | 0.524918 | 0.00000 | 19.0368 | 09970070 | -0.000601475 | 0.525519 | 19.0746 |
| 1 | 09970072 | 0.519098 | 0.00582004 | 19.0769 | 09970069 | 0.000354141 | 0.524564 | 19.0874 |
| 2 | 09970067 | 0.524641 | 0.000277042 | 19.0361 | 09970066 | 0.00000 | 0.524918 | 19.0682 |
| 3 | 09970071 | 0.519536 | 0.00538200 | 19.0340 | 09970073 | -0.00182474 | 0.526743 | 18.9724 |