| Red | Green | Blue | |
| z | 17.64 | ||
| znorm | Inf | ||
| sky | -Inf | -Inf | -Inf |
| S/N | 26.3 | 44.1 | 46.1 |
| S/N(c) | 0.0 | 0.0 | 0.0 |
| SN(E/C) |
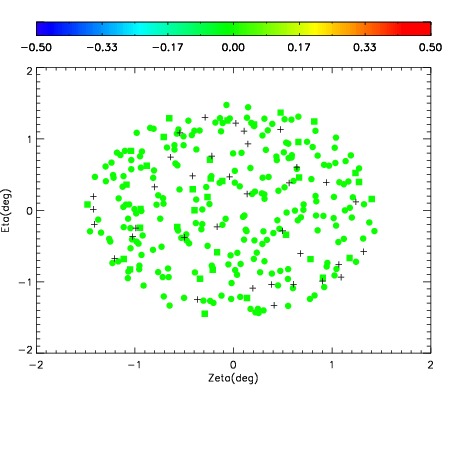
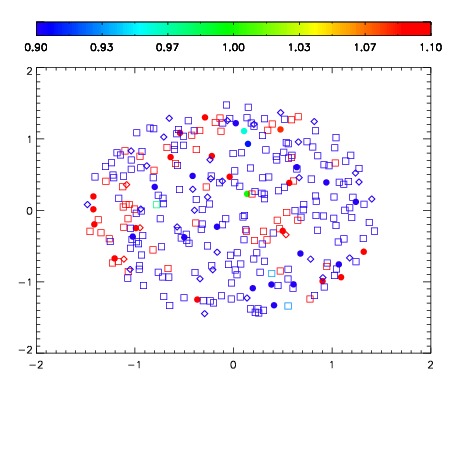
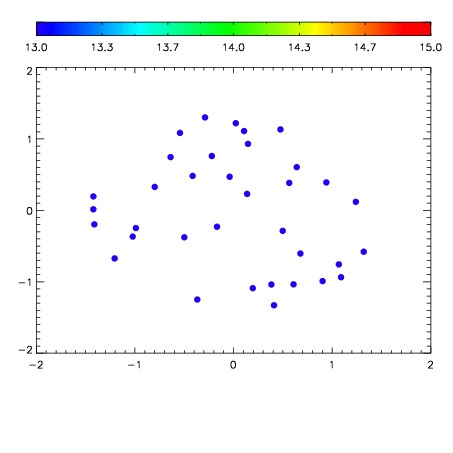

| Frame | Nreads | Zeropoints | Mag plots | Spatial mag deviation | Spatial sky 16325A emission deviations (filled: sky, open: star) | Spatial sky continuum emission | Spatial sky telluric CO2 absorption deviations (filled: H < 10) | |||||||||||||||||||||||
| 0 | 0 |
|
|
|
|
|
|
| IPAIR | NAME | SHIFT | NEWSHIFT | S/N | NAME | SHIFT | NEWSHIFT | S/N |
| 0 | 03700010 | 0.496088 | 0.00000 | 19.0222 | 03700011 | 0.00160491 | 0.494483 | 18.9282 |
| 1 | 03700013 | 0.492850 | 0.00323799 | 19.1119 | 03700015 | -0.000495782 | 0.496584 | 19.1589 |
| 2 | 03700014 | 0.493769 | 0.00231901 | 19.1073 | 03700012 | 0.000685522 | 0.495402 | 19.0855 |
| 3 | 03700009 | 0.492878 | 0.00321001 | 19.0466 | 03700008 | 0.00000 | 0.496088 | 18.9869 |