| Red | Green | Blue | |
| z | 17.64 | ||
| znorm | Inf | ||
| sky | -NaN | -NaN | -NaN |
| S/N | 29.2 | 47.2 | 51.6 |
| S/N(c) | 0.0 | 0.0 | 0.0 |
| SN(E/C) |
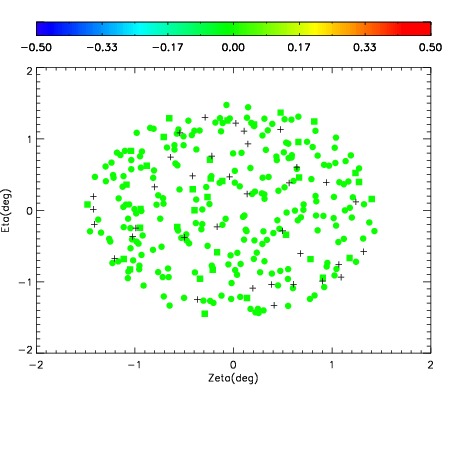
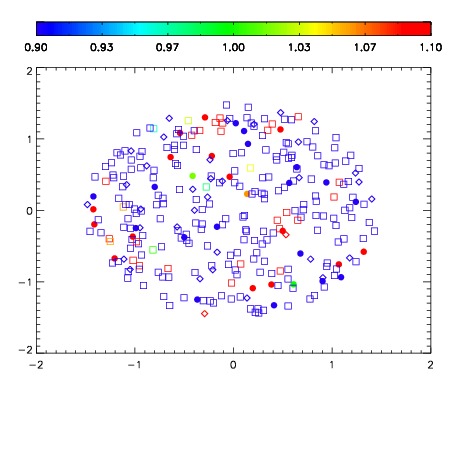
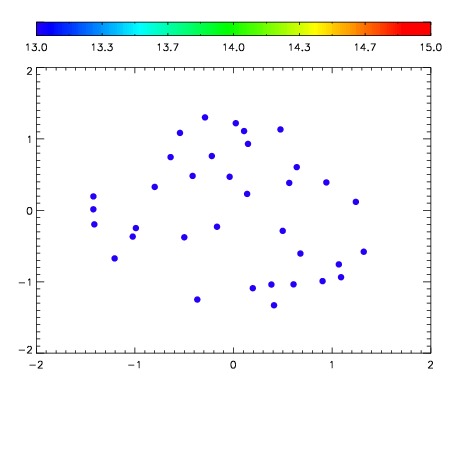

| Frame | Nreads | Zeropoints | Mag plots | Spatial mag deviation | Spatial sky 16325A emission deviations (filled: sky, open: star) | Spatial sky continuum emission | Spatial sky telluric CO2 absorption deviations (filled: H < 10) | |||||||||||||||||||||||
| 0 | 0 |
|
|
|
|
|
|
| IPAIR | NAME | SHIFT | NEWSHIFT | S/N | NAME | SHIFT | NEWSHIFT | S/N |
| 0 | 06730017 | 0.483940 | 0.00000 | 19.1647 | 06730015 | 0.00165582 | 0.482284 | 19.1760 |
| 1 | 06730013 | 0.483732 | 0.000207990 | 19.1933 | 06730018 | -0.00487307 | 0.488813 | 19.1815 |
| 2 | 06730012 | 0.481898 | 0.00204200 | 19.1640 | 06730014 | 0.000746524 | 0.483193 | 19.1607 |
| 3 | 06730016 | 0.481159 | 0.00278100 | 19.1508 | 06730011 | 0.00000 | 0.483940 | 19.1487 |