| Red | Green | Blue | |
| z | 17.64 | ||
| znorm | Inf | ||
| sky | -Inf | -Inf | -Inf |
| S/N | 26.2 | 45.9 | 47.5 |
| S/N(c) | 0.0 | 0.0 | 0.0 |
| SN(E/C) |


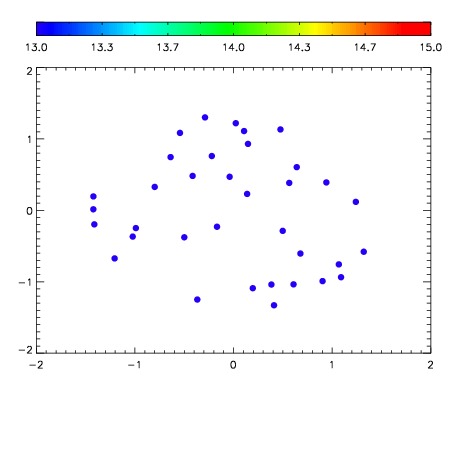

| Frame | Nreads | Zeropoints | Mag plots | Spatial mag deviation | Spatial sky 16325A emission deviations (filled: sky, open: star) | Spatial sky continuum emission | Spatial sky telluric CO2 absorption deviations (filled: H < 10) | |||||||||||||||||||||||
| 0 | 0 |
|
|
|
|
|
|
| IPAIR | NAME | SHIFT | NEWSHIFT | S/N | NAME | SHIFT | NEWSHIFT | S/N |
| 0 | 06970032 | 0.488770 | 0.00000 | 19.1144 | 06970030 | -0.00107878 | 0.489849 | 19.1074 |
| 1 | 06970031 | 0.488283 | 0.000487000 | 19.0890 | 06970029 | 0.00135631 | 0.487414 | 19.0662 |
| 2 | 06970027 | 0.485201 | 0.00356901 | 19.0838 | 06970026 | 0.00000 | 0.488770 | 19.0579 |
| 3 | 06970028 | 0.486125 | 0.00264502 | 19.0770 | 06970033 | 0.00186870 | 0.486901 | 19.0473 |