| Red | Green | Blue | |
| z | 17.64 | ||
| znorm | Inf | ||
| sky | -Inf | -Inf | -Inf |
| S/N | 27.5 | 44.5 | 45.2 |
| S/N(c) | 0.0 | 0.0 | 0.0 |
| SN(E/C) |
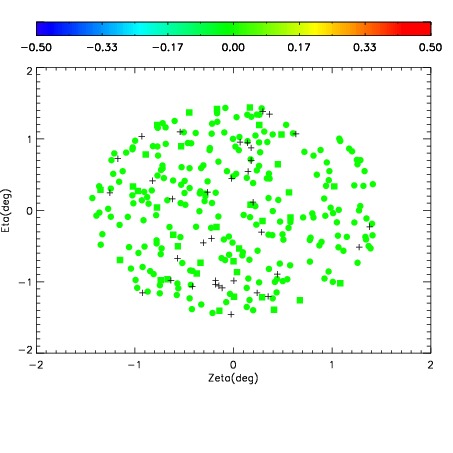
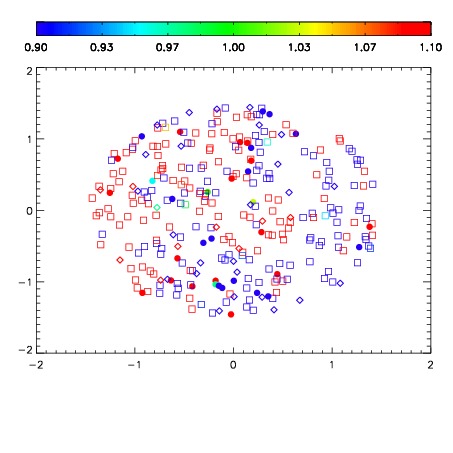
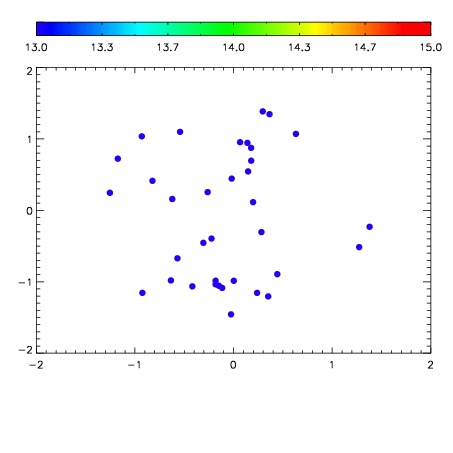

| Frame | Nreads | Zeropoints | Mag plots | Spatial mag deviation | Spatial sky 16325A emission deviations (filled: sky, open: star) | Spatial sky continuum emission | Spatial sky telluric CO2 absorption deviations (filled: H < 10) | |||||||||||||||||||||||
| 0 | 0 |
|
|
|
|
|
|
| IPAIR | NAME | SHIFT | NEWSHIFT | S/N | NAME | SHIFT | NEWSHIFT | S/N |
| 0 | 03640012 | 0.511626 | 0.00000 | 18.9671 | 03640014 | 0.000657353 | 0.510969 | 18.9700 |
| 1 | 03640015 | 0.508358 | 0.00326800 | 18.9873 | 03640017 | 0.00156453 | 0.510062 | 19.0304 |
| 2 | 03640016 | 0.509766 | 0.00186002 | 18.9848 | 03640010 | 0.00000 | 0.511626 | 19.0003 |
| 3 | 03640011 | 0.509610 | 0.00201601 | 18.9023 | 03640013 | 0.00202581 | 0.509600 | 18.9047 |