| Red | Green | Blue | |
| z | 17.64 | ||
| znorm | Inf | ||
| sky | -Inf | -NaN | -Inf |
| S/N | 23.6 | 39.4 | 39.9 |
| S/N(c) | 0.0 | 0.0 | 0.0 |
| SN(E/C) |
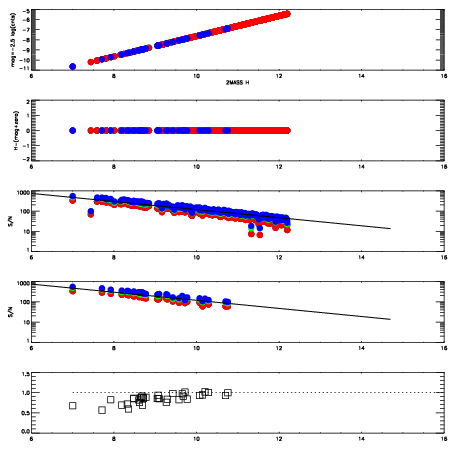
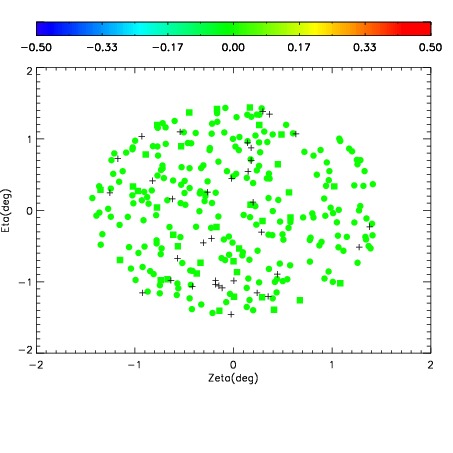
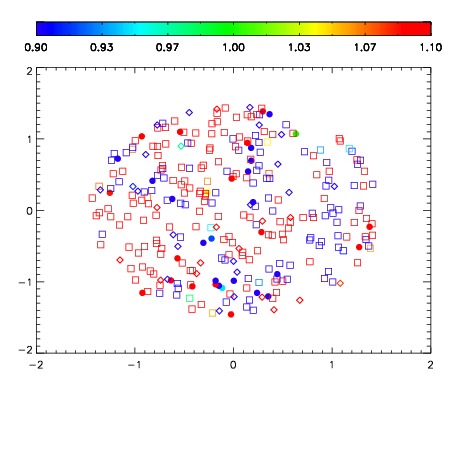
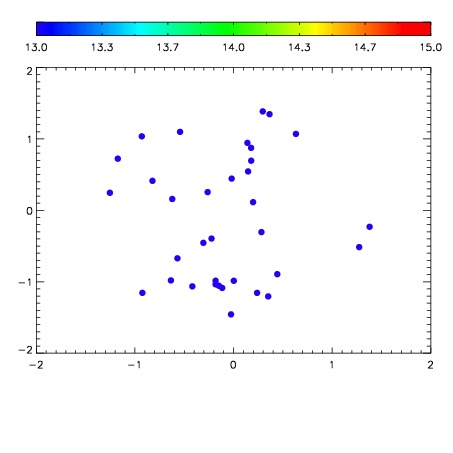

| Frame | Nreads | Zeropoints | Mag plots | Spatial mag deviation | Spatial sky 16325A emission deviations (filled: sky, open: star) | Spatial sky continuum emission | Spatial sky telluric CO2 absorption deviations (filled: H < 10) | |||||||||||||||||||||||
| 0 | 0 |
|
|
|
|
|
|
| IPAIR | NAME | SHIFT | NEWSHIFT | S/N | NAME | SHIFT | NEWSHIFT | S/N |
| 0 | 03680013 | 0.507249 | 0.00000 | 18.9570 | 03680012 | 0.00324631 | 0.504003 | 18.9579 |
| 1 | 03680014 | 0.507223 | 2.59876e-05 | 19.1070 | 03680015 | 0.00301654 | 0.504232 | 19.0782 |
| 2 | 03680009 | 0.502312 | 0.00493699 | 18.8289 | 03680011 | 0.00207494 | 0.505174 | 18.7992 |
| 3 | 03680010 | 0.504363 | 0.00288600 | 18.7595 | 03680008 | 0.00000 | 0.507249 | 18.5420 |