| Red | Green | Blue | |
| z | 17.64 | ||
| znorm | Inf | ||
| sky | -NaN | -Inf | -Inf |
| S/N | 32.6 | 53.6 | 55.6 |
| S/N(c) | 0.0 | 0.0 | 0.0 |
| SN(E/C) |


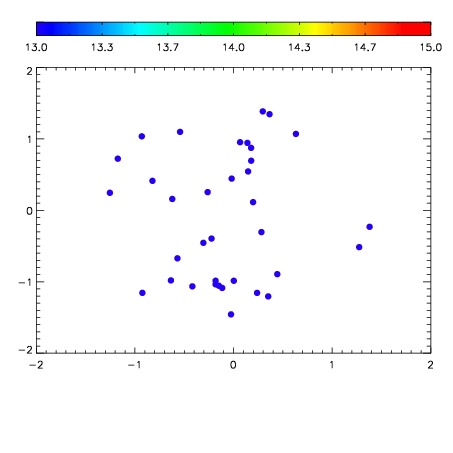

| Frame | Nreads | Zeropoints | Mag plots | Spatial mag deviation | Spatial sky 16325A emission deviations (filled: sky, open: star) | Spatial sky continuum emission | Spatial sky telluric CO2 absorption deviations (filled: H < 10) | |||||||||||||||||||||||
| 0 | 0 |
|
|
|
|
|
|
| IPAIR | NAME | SHIFT | NEWSHIFT | S/N | NAME | SHIFT | NEWSHIFT | S/N |
| 0 | 06070086 | 0.476857 | 0.00000 | 19.1234 | 06070088 | -0.000642990 | 0.477500 | 19.0916 |
| 1 | 06070089 | 0.474469 | 0.00238800 | 19.1168 | 06070087 | -0.000583611 | 0.477441 | 19.0791 |
| 2 | 06070081 | 0.475046 | 0.00181100 | 19.1053 | 06070083 | -0.00208380 | 0.478941 | 19.0483 |
| 3 | 06070085 | 0.476690 | 0.000167012 | 19.0612 | 06070080 | 0.00000 | 0.476857 | 19.0462 |
| 4 | 06070082 | 0.474731 | 0.00212601 | 19.0419 | 06070084 | -0.000747134 | 0.477604 | 19.0193 |