| Red | Green | Blue | |
| z | 17.64 | ||
| znorm | Inf | ||
| sky | -Inf | -Inf | -Inf |
| S/N | 25.6 | 44.0 | 46.0 |
| S/N(c) | 0.0 | 0.0 | 0.0 |
| SN(E/C) |
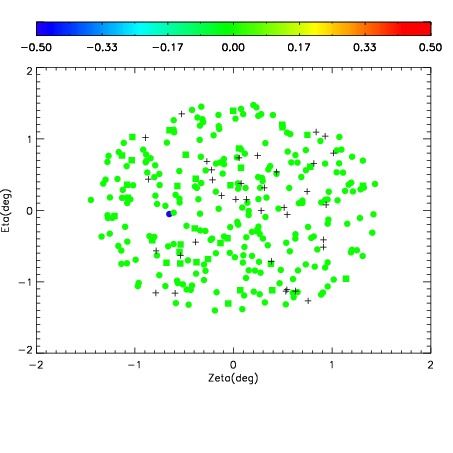
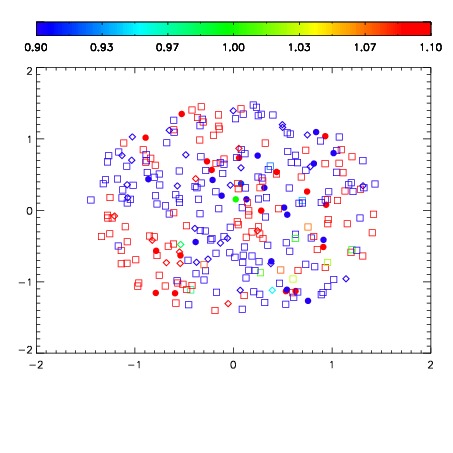


| Frame | Nreads | Zeropoints | Mag plots | Spatial mag deviation | Spatial sky 16325A emission deviations (filled: sky, open: star) | Spatial sky continuum emission | Spatial sky telluric CO2 absorption deviations (filled: H < 10) | |||||||||||||||||||||||
| 0 | 0 |
|
|
|
|
|
|
| IPAIR | NAME | SHIFT | NEWSHIFT | S/N | NAME | SHIFT | NEWSHIFT | S/N |
| 0 | 03720010 | 0.506941 | 0.00000 | 19.0193 | 03720012 | -0.00174515 | 0.508686 | 19.0073 |
| 1 | 03720014 | 0.503885 | 0.00305605 | 19.0035 | 03720008 | 0.00000 | 0.506941 | 18.9839 |
| 2 | 03720009 | 0.501153 | 0.00578803 | 18.9987 | 03720011 | 0.000102571 | 0.506838 | 18.9784 |
| 3 | 03720013 | 0.502668 | 0.00427300 | 18.9925 | 03720015 | 0.00238820 | 0.504553 | 18.9772 |