| Red | Green | Blue | |
| z | 17.64 | ||
| znorm | Inf | ||
| sky | -Inf | -Inf | -Inf |
| S/N | 28.3 | 47.5 | 51.4 |
| S/N(c) | 0.0 | 0.0 | 0.0 |
| SN(E/C) |


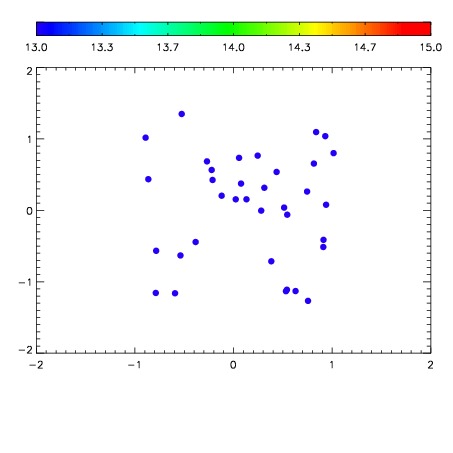

| Frame | Nreads | Zeropoints | Mag plots | Spatial mag deviation | Spatial sky 16325A emission deviations (filled: sky, open: star) | Spatial sky continuum emission | Spatial sky telluric CO2 absorption deviations (filled: H < 10) | |||||||||||||||||||||||
| 0 | 0 |
|
|
|
|
|
|
| IPAIR | NAME | SHIFT | NEWSHIFT | S/N | NAME | SHIFT | NEWSHIFT | S/N |
| 0 | 10200076 | 0.493410 | 0.00000 | 19.0565 | 10200077 | 0.00102373 | 0.492386 | 19.0985 |
| 1 | 10200072 | 0.492201 | 0.00120899 | 19.2176 | 10200070 | 0.00000 | 0.493410 | 19.1903 |
| 2 | 10200071 | 0.492002 | 0.00140798 | 19.2129 | 10200074 | 0.00116532 | 0.492245 | 19.1832 |
| 3 | 10200075 | 0.492936 | 0.000474006 | 19.1496 | 10200073 | 0.00138313 | 0.492027 | 19.1439 |