| Red | Green | Blue | |
| z | 17.64 | ||
| znorm | Inf | ||
| sky | -NaN | -NaN | -Inf |
| S/N | 28.2 | 46.9 | 52.4 |
| S/N(c) | 0.0 | 0.0 | 0.0 |
| SN(E/C) |

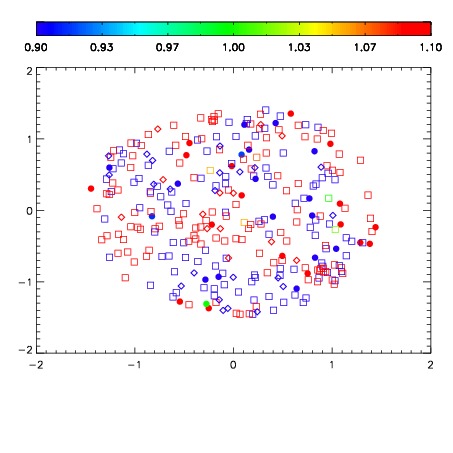
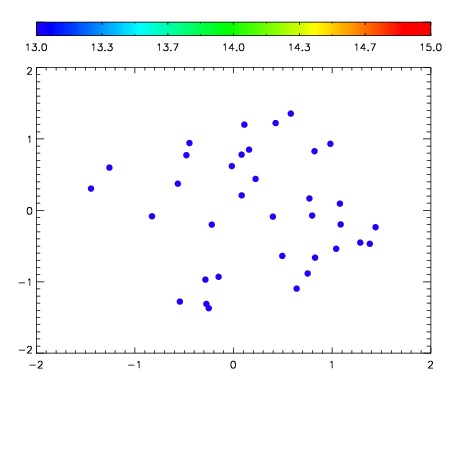

| Frame | Nreads | Zeropoints | Mag plots | Spatial mag deviation | Spatial sky 16325A emission deviations (filled: sky, open: star) | Spatial sky continuum emission | Spatial sky telluric CO2 absorption deviations (filled: H < 10) | |||||||||||||||||||||||
| 0 | 0 |
|
|
|
|
|
|
| IPAIR | NAME | SHIFT | NEWSHIFT | S/N | NAME | SHIFT | NEWSHIFT | S/N |
| 0 | 03670014 | 0.504650 | 0.00000 | 19.2185 | 03670015 | 0.00364329 | 0.501007 | 19.2306 |
| 1 | 03670010 | 0.502711 | 0.00193900 | 19.1722 | 03670012 | 0.00100945 | 0.503641 | 19.1855 |
| 2 | 03670009 | 0.501113 | 0.00353700 | 19.1633 | 03670008 | 0.00000 | 0.504650 | 19.1825 |
| 3 | 03670013 | 0.500746 | 0.00390399 | 19.1520 | 03670011 | 0.00147492 | 0.503175 | 19.1812 |