| Red | Green | Blue | |
| z | 17.64 | ||
| znorm | Inf | ||
| sky | -NaN | -NaN | -Inf |
| S/N | 29.1 | 49.2 | 50.9 |
| S/N(c) | 0.0 | 0.0 | 0.0 |
| SN(E/C) |
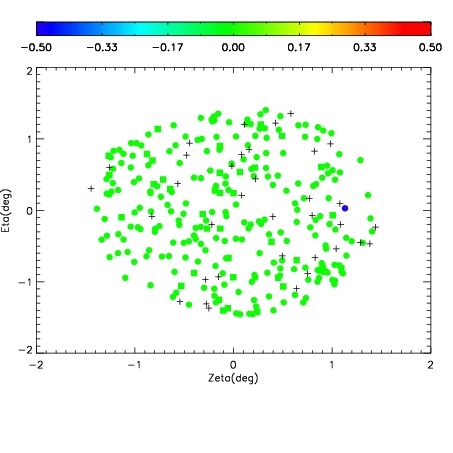
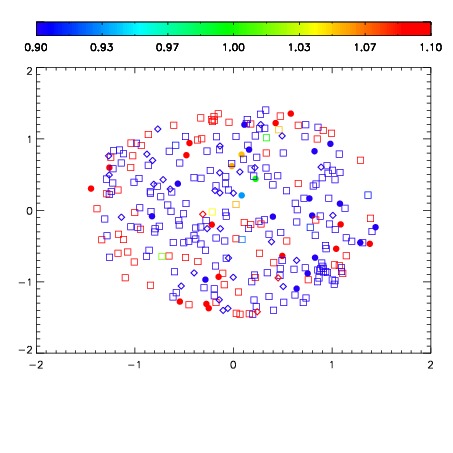
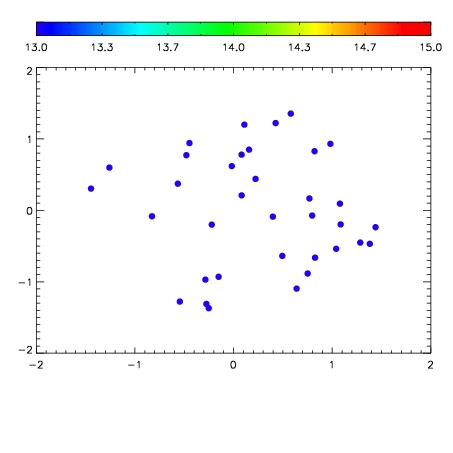

| Frame | Nreads | Zeropoints | Mag plots | Spatial mag deviation | Spatial sky 16325A emission deviations (filled: sky, open: star) | Spatial sky continuum emission | Spatial sky telluric CO2 absorption deviations (filled: H < 10) | |||||||||||||||||||||||
| 0 | 0 |
|
|
|
|
|
|
| IPAIR | NAME | SHIFT | NEWSHIFT | S/N | NAME | SHIFT | NEWSHIFT | S/N |
| 0 | 10450060 | 0.505037 | 0.00000 | 19.1635 | 10450058 | 0.00000 | 0.505037 | 19.1389 |
| 1 | 10450064 | 0.504824 | 0.000213027 | 19.1808 | 10450061 | 0.00251118 | 0.502526 | 19.1775 |
| 2 | 10450059 | 0.504636 | 0.000401020 | 19.1789 | 10450065 | 0.00344069 | 0.501596 | 19.1703 |
| 3 | 10450063 | 0.503508 | 0.00152904 | 19.1763 | 10450062 | 0.00236255 | 0.502674 | 19.1636 |