| Red | Green | Blue | |
| z | 17.64 | ||
| znorm | Inf | ||
| sky | -Inf | -Inf | -Inf |
| S/N | 23.0 | 39.1 | 43.4 |
| S/N(c) | 0.0 | 0.0 | 0.0 |
| SN(E/C) |
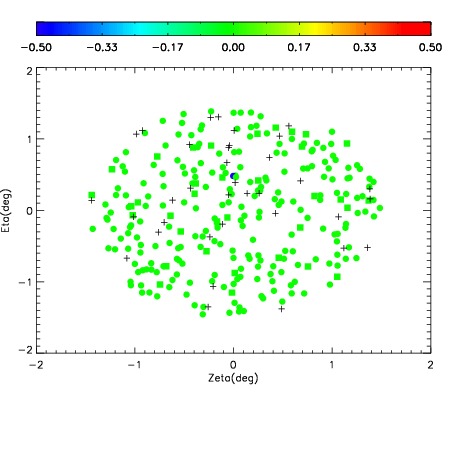

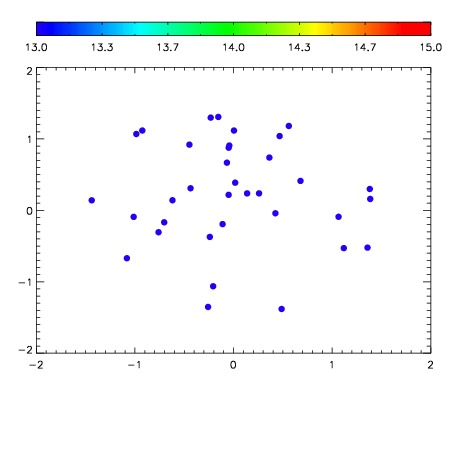

| Frame | Nreads | Zeropoints | Mag plots | Spatial mag deviation | Spatial sky 16325A emission deviations (filled: sky, open: star) | Spatial sky continuum emission | Spatial sky telluric CO2 absorption deviations (filled: H < 10) | |||||||||||||||||||||||
| 0 | 0 |
|
|
|
|
|
|
| IPAIR | NAME | SHIFT | NEWSHIFT | S/N | NAME | SHIFT | NEWSHIFT | S/N |
| 0 | 03750016 | 0.499414 | 0.00000 | 18.1618 | 03750017 | 0.00218600 | 0.497228 | 18.5033 |
| 1 | 03750019 | 0.496134 | 0.00327998 | 18.6748 | 03750010 | 0.00000 | 0.499414 | 18.7019 |
| 2 | 03750012 | 0.495045 | 0.00436899 | 18.6585 | 03750013 | 0.00170969 | 0.497704 | 18.6897 |
| 3 | 03750020 | 0.497561 | 0.00185299 | 18.6426 | 03750021 | -0.00241155 | 0.501826 | 18.6144 |
| 4 | 03750015 | 0.494117 | 0.00529701 | 18.4699 | 03750018 | -0.00182086 | 0.501235 | 18.6121 |
| 5 | 03750011 | 0.491847 | 0.00756699 | 18.4060 | 03750014 | 0.000603341 | 0.498811 | 18.5977 |