| Red | Green | Blue | |
| z | 17.64 | ||
| znorm | Inf | ||
| sky | -Inf | -NaN | -Inf |
| S/N | 32.7 | 54.6 | 57.5 |
| S/N(c) | 0.0 | 0.0 | 0.0 |
| SN(E/C) |


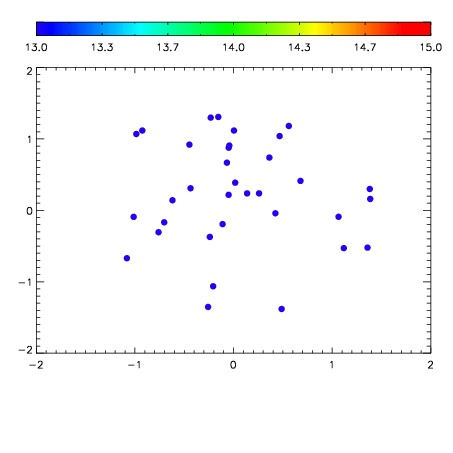

| Frame | Nreads | Zeropoints | Mag plots | Spatial mag deviation | Spatial sky 16325A emission deviations (filled: sky, open: star) | Spatial sky continuum emission | Spatial sky telluric CO2 absorption deviations (filled: H < 10) | |||||||||||||||||||||||
| 0 | 0 |
|
|
|
|
|
|
| IPAIR | NAME | SHIFT | NEWSHIFT | S/N | NAME | SHIFT | NEWSHIFT | S/N |
| 0 | 10210081 | 0.493334 | 0.00000 | 19.1879 | 10210079 | 0.00325862 | 0.490075 | 19.1744 |
| 1 | 10210078 | 0.492430 | 0.000903994 | 19.1640 | 10210080 | 0.00277877 | 0.490555 | 19.1730 |
| 2 | 10210077 | 0.491829 | 0.00150499 | 19.1550 | 10210076 | 0.00400156 | 0.489332 | 19.1508 |
| 3 | 10210073 | 0.491754 | 0.00158000 | 19.1460 | 10210075 | 0.00387295 | 0.489461 | 19.1431 |
| 4 | 10210074 | 0.491346 | 0.00198799 | 19.1409 | 10210072 | 0.00000 | 0.493334 | 19.0879 |