| Red | Green | Blue | |
| z | 17.64 | ||
| znorm | Inf | ||
| sky | -Inf | -Inf | -Inf |
| S/N | 26.7 | 45.9 | 49.1 |
| S/N(c) | 0.0 | 0.0 | 0.0 |
| SN(E/C) |
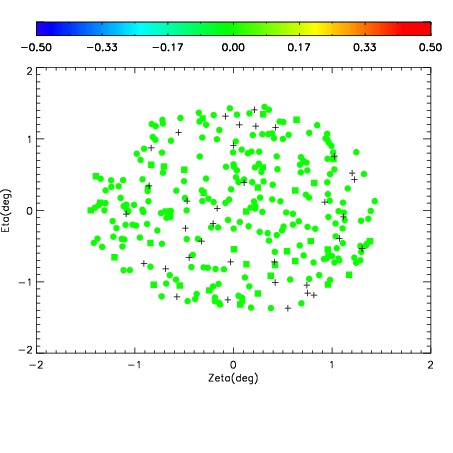
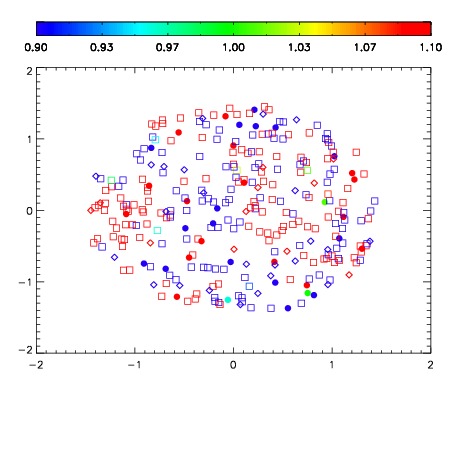
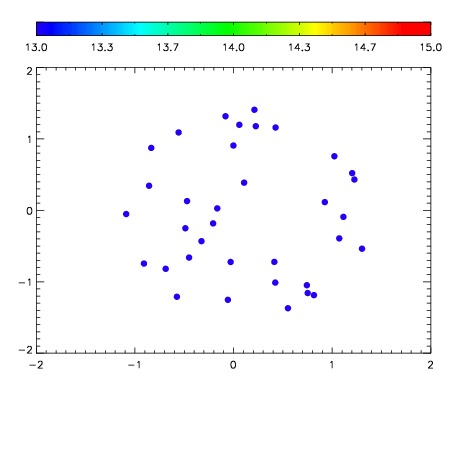

| Frame | Nreads | Zeropoints | Mag plots | Spatial mag deviation | Spatial sky 16325A emission deviations (filled: sky, open: star) | Spatial sky continuum emission | Spatial sky telluric CO2 absorption deviations (filled: H < 10) | |||||||||||||||||||||||
| 0 | 0 |
|
|
|
|
|
|
| IPAIR | NAME | SHIFT | NEWSHIFT | S/N | NAME | SHIFT | NEWSHIFT | S/N |
| 0 | 03660010 | 0.508703 | 0.00000 | 19.0319 | 03660015 | 0.00158433 | 0.507119 | 19.0458 |
| 1 | 03660013 | 0.499384 | 0.00931901 | 19.0111 | 03660011 | 0.00180084 | 0.506902 | 19.0206 |
| 2 | 03660009 | 0.504591 | 0.00411201 | 19.0053 | 03660012 | -0.00108933 | 0.509792 | 18.9992 |
| 3 | 03660014 | 0.502824 | 0.00587898 | 18.9900 | 03660008 | 0.00000 | 0.508703 | 18.9549 |