| Red | Green | Blue | |
| z | 17.64 | ||
| znorm | Inf | ||
| sky | -Inf | -Inf | -Inf |
| S/N | 27.2 | 45.3 | 47.9 |
| S/N(c) | 0.0 | 0.0 | 0.0 |
| SN(E/C) |
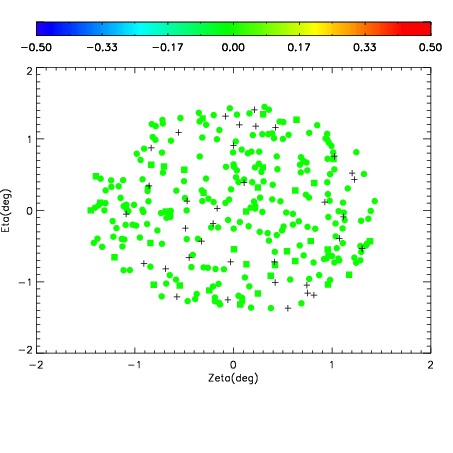
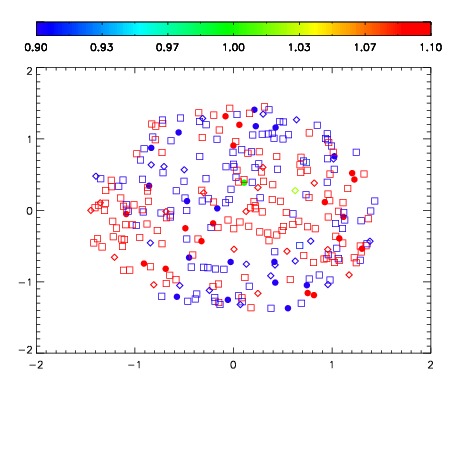
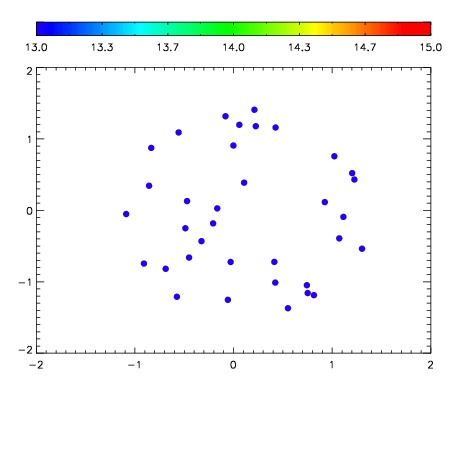

| Frame | Nreads | Zeropoints | Mag plots | Spatial mag deviation | Spatial sky 16325A emission deviations (filled: sky, open: star) | Spatial sky continuum emission | Spatial sky telluric CO2 absorption deviations (filled: H < 10) | |||||||||||||||||||||||
| 0 | 0 |
|
|
|
|
|
|
| IPAIR | NAME | SHIFT | NEWSHIFT | S/N | NAME | SHIFT | NEWSHIFT | S/N |
| 0 | 07520017 | 0.481942 | 0.00000 | 19.0218 | 07520011 | 0.00000 | 0.481942 | 19.0687 |
| 1 | 07520012 | 0.479120 | 0.00282201 | 19.0292 | 07520018 | 0.00548992 | 0.476452 | 19.0815 |
| 2 | 07520013 | 0.478933 | 0.00300899 | 19.0210 | 07520014 | 0.000907252 | 0.481035 | 19.0057 |
| 3 | 07520016 | 0.480518 | 0.00142398 | 18.9869 | 07520015 | 0.00245635 | 0.479486 | 18.9711 |