| Red | Green | Blue | |
| z | 17.64 | ||
| znorm | Inf | ||
| sky | -Inf | -Inf | -Inf |
| S/N | 28.2 | 47.6 | 50.1 |
| S/N(c) | 0.0 | 0.0 | 0.0 |
| SN(E/C) |
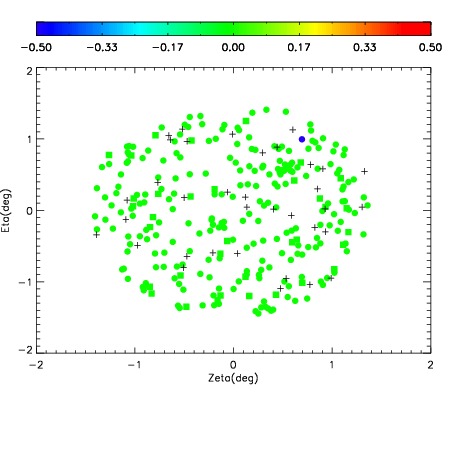
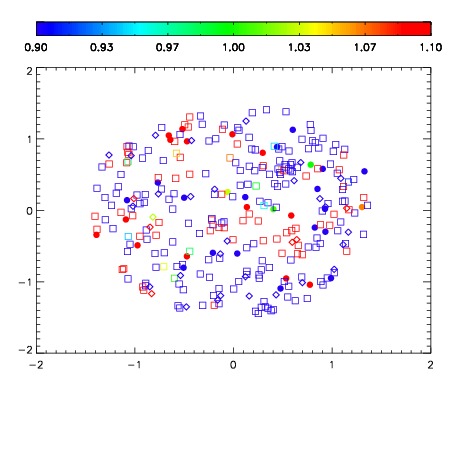
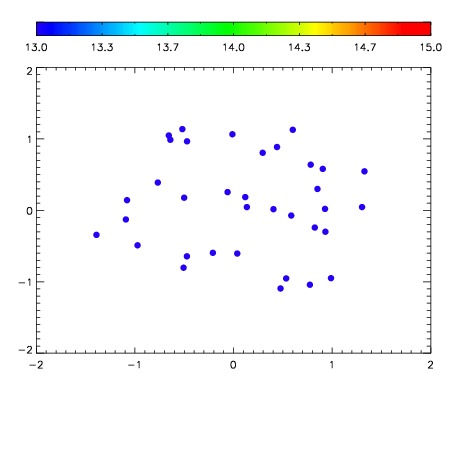

| Frame | Nreads | Zeropoints | Mag plots | Spatial mag deviation | Spatial sky 16325A emission deviations (filled: sky, open: star) | Spatial sky continuum emission | Spatial sky telluric CO2 absorption deviations (filled: H < 10) | |||||||||||||||||||||||
| 0 | 0 |
|
|
|
|
|
|
| IPAIR | NAME | SHIFT | NEWSHIFT | S/N | NAME | SHIFT | NEWSHIFT | S/N |
| 0 | 03660030 | 0.499120 | 0.00000 | 19.1057 | 03660028 | 0.00117403 | 0.497946 | 19.0819 |
| 1 | 03660029 | 0.497634 | 0.00148600 | 19.0886 | 03660031 | 0.00304783 | 0.496072 | 19.0485 |
| 2 | 03660026 | 0.499099 | 2.10106e-05 | 18.9970 | 03660027 | 0.000665888 | 0.498454 | 19.0387 |
| 3 | 03660025 | 0.497687 | 0.00143299 | 18.8961 | 03660024 | 0.00000 | 0.499120 | 18.9400 |