| Red | Green | Blue | |
| z | 17.64 | ||
| znorm | Inf | ||
| sky | -Inf | -Inf | -Inf |
| S/N | 34.7 | 58.2 | 59.3 |
| S/N(c) | 0.0 | 0.0 | 0.0 |
| SN(E/C) |
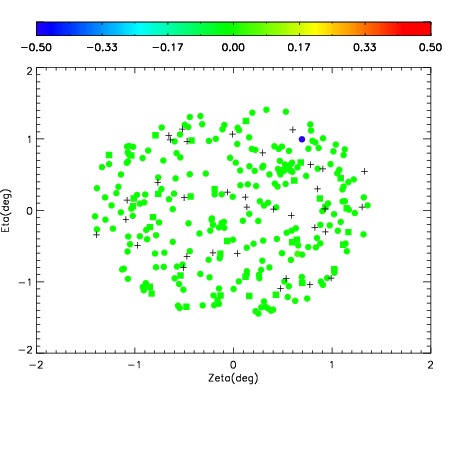
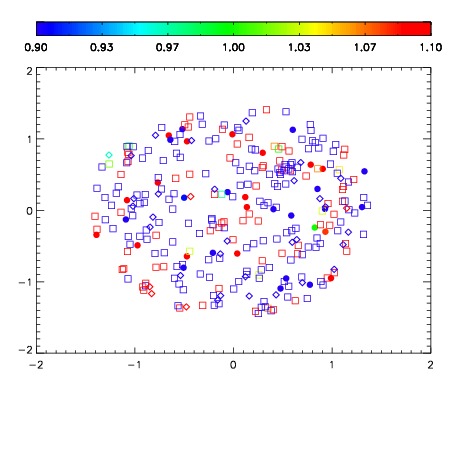
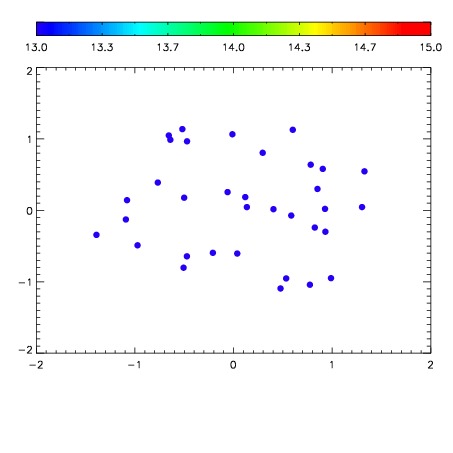

| Frame | Nreads | Zeropoints | Mag plots | Spatial mag deviation | Spatial sky 16325A emission deviations (filled: sky, open: star) | Spatial sky continuum emission | Spatial sky telluric CO2 absorption deviations (filled: H < 10) | |||||||||||||||||||||||
| 0 | 0 |
|
|
|
|
|
|
| IPAIR | NAME | SHIFT | NEWSHIFT | S/N | NAME | SHIFT | NEWSHIFT | S/N |
| 0 | 03720033 | 0.503437 | 0.00000 | 19.1553 | 03720034 | -0.00220342 | 0.505640 | 19.1513 |
| 1 | 03720032 | 0.502188 | 0.00124896 | 19.1431 | 03720031 | -0.00304408 | 0.506481 | 19.1100 |
| 2 | 03720029 | 0.502325 | 0.00111198 | 19.0640 | 03720030 | -0.00305678 | 0.506494 | 19.0633 |
| 3 | 03720028 | 0.501357 | 0.00207996 | 19.0402 | 03720026 | -0.00163486 | 0.505072 | 19.0178 |
| 4 | 03720025 | 0.500362 | 0.00307500 | 19.0227 | 03720027 | -0.00316266 | 0.506600 | 18.9900 |
| 5 | 03720024 | 0.501166 | 0.00227100 | 18.9949 | 03720023 | 0.00000 | 0.503437 | 18.9896 |