| Red | Green | Blue | |
| z | 17.64 | ||
| znorm | Inf | ||
| sky | -Inf | -Inf | -Inf |
| S/N | 30.5 | 50.0 | 52.4 |
| S/N(c) | 0.0 | 0.0 | 0.0 |
| SN(E/C) |
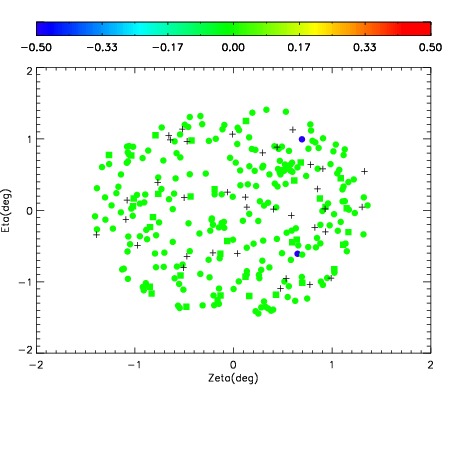
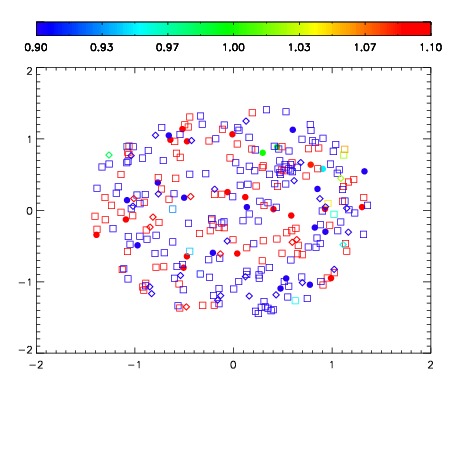
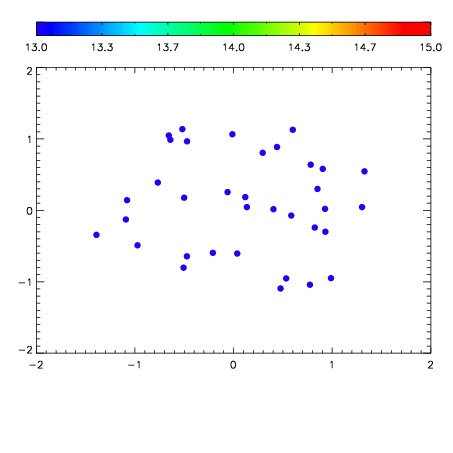

| Frame | Nreads | Zeropoints | Mag plots | Spatial mag deviation | Spatial sky 16325A emission deviations (filled: sky, open: star) | Spatial sky continuum emission | Spatial sky telluric CO2 absorption deviations (filled: H < 10) | |||||||||||||||||||||||
| 0 | 0 |
|
|
|
|
|
|
| IPAIR | NAME | SHIFT | NEWSHIFT | S/N | NAME | SHIFT | NEWSHIFT | S/N |
| 0 | 03950013 | 0.505492 | 0.00000 | 19.0933 | 03950012 | 0.00000 | 0.505492 | 19.0884 |
| 1 | 03950018 | 0.496952 | 0.00853997 | 19.1928 | 03950019 | -0.00261325 | 0.508105 | 19.2151 |
| 2 | 03950017 | 0.496724 | 0.00876796 | 19.1813 | 03950015 | -7.63717e-05 | 0.505568 | 19.1172 |
| 3 | 03950014 | 0.504558 | 0.000933945 | 19.1671 | 03950016 | -0.00194050 | 0.507432 | 19.0991 |