| Red | Green | Blue | |
| z | 17.64 | ||
| znorm | Inf | ||
| sky | -Inf | -Inf | -Inf |
| S/N | 22.9 | 39.6 | 41.6 |
| S/N(c) | 0.0 | 0.0 | 0.0 |
| SN(E/C) |
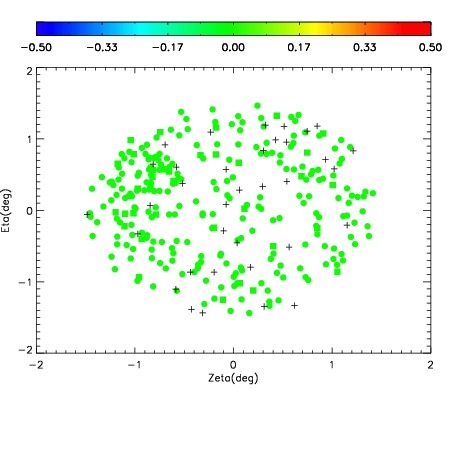
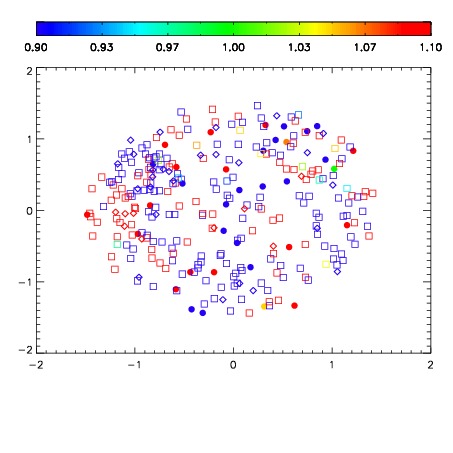


| Frame | Nreads | Zeropoints | Mag plots | Spatial mag deviation | Spatial sky 16325A emission deviations (filled: sky, open: star) | Spatial sky continuum emission | Spatial sky telluric CO2 absorption deviations (filled: H < 10) | |||||||||||||||||||||||
| 0 | 0 |
|
|
|
|
|
|
| IPAIR | NAME | SHIFT | NEWSHIFT | S/N | NAME | SHIFT | NEWSHIFT | S/N |
| 0 | 03980014 | 0.498930 | 0.00000 | 18.8029 | 03980011 | 0.00133177 | 0.497598 | 18.8043 |
| 1 | 03980010 | 0.498432 | 0.000497997 | 18.8421 | 03980015 | 0.00142584 | 0.497504 | 18.8592 |
| 2 | 03980009 | 0.497758 | 0.00117201 | 18.8294 | 03980012 | -0.000208480 | 0.499138 | 18.8427 |
| 3 | 03980013 | 0.498318 | 0.000612020 | 18.7796 | 03980008 | 0.00000 | 0.498930 | 18.7115 |