| Red | Green | Blue | |
| z | 17.64 | ||
| znorm | Inf | ||
| sky | -NaN | -Inf | -Inf |
| S/N | 28.8 | 48.4 | 50.7 |
| S/N(c) | 0.0 | 0.0 | 0.0 |
| SN(E/C) |
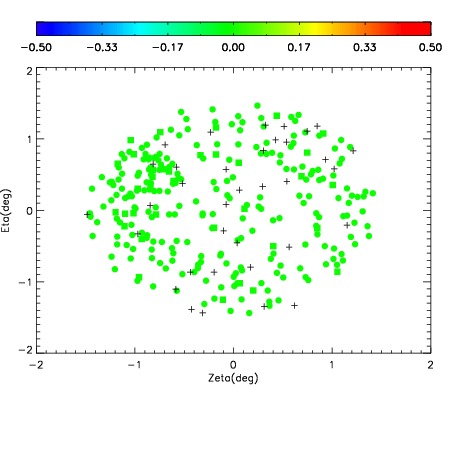
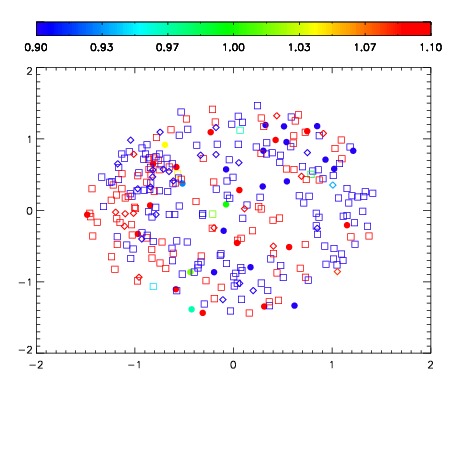
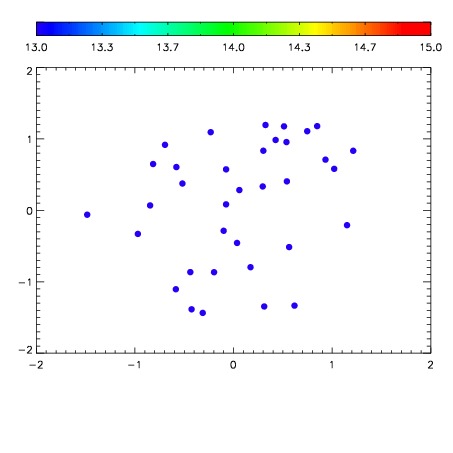

| Frame | Nreads | Zeropoints | Mag plots | Spatial mag deviation | Spatial sky 16325A emission deviations (filled: sky, open: star) | Spatial sky continuum emission | Spatial sky telluric CO2 absorption deviations (filled: H < 10) | |||||||||||||||||||||||
| 0 | 0 |
|
|
|
|
|
|
| IPAIR | NAME | SHIFT | NEWSHIFT | S/N | NAME | SHIFT | NEWSHIFT | S/N |
| 0 | 04040016 | 0.494590 | 0.00000 | 19.0137 | 04040017 | 0.000742999 | 0.493847 | 19.0569 |
| 1 | 04040011 | 0.491689 | 0.00290102 | 19.2153 | 04040010 | 0.00000 | 0.494590 | 19.1708 |
| 2 | 04040012 | 0.492460 | 0.00213000 | 19.1918 | 04040013 | 0.00224244 | 0.492348 | 19.1312 |
| 3 | 04040015 | 0.493445 | 0.00114501 | 19.0841 | 04040014 | 0.000593394 | 0.493997 | 19.0671 |