| Red | Green | Blue | |
| z | 17.64 | ||
| znorm | Inf | ||
| sky | -Inf | -Inf | -Inf |
| S/N | 27.8 | 45.7 | 48.2 |
| S/N(c) | 0.0 | 0.0 | 0.0 |
| SN(E/C) |
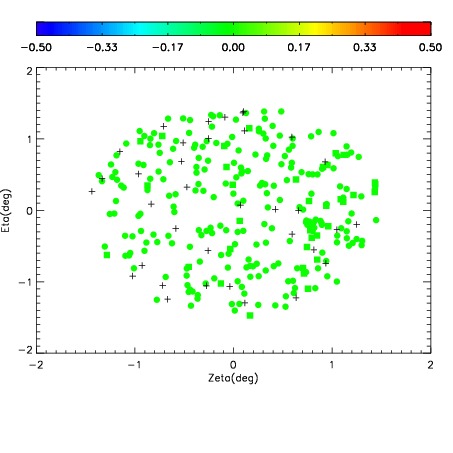
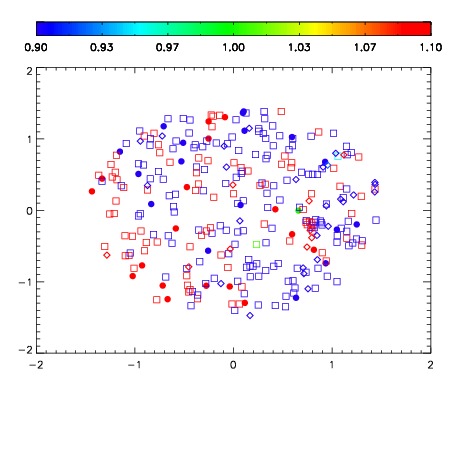
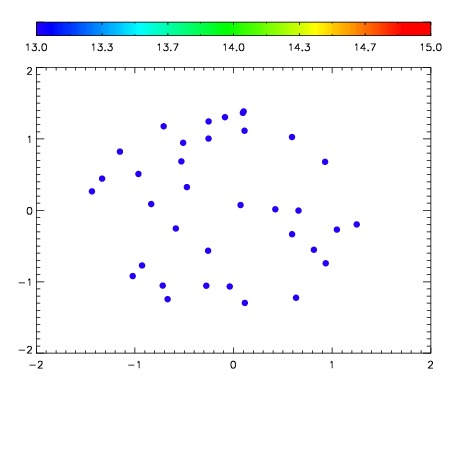

| Frame | Nreads | Zeropoints | Mag plots | Spatial mag deviation | Spatial sky 16325A emission deviations (filled: sky, open: star) | Spatial sky continuum emission | Spatial sky telluric CO2 absorption deviations (filled: H < 10) | |||||||||||||||||||||||
| 0 | 0 |
|
|
|
|
|
|
| IPAIR | NAME | SHIFT | NEWSHIFT | S/N | NAME | SHIFT | NEWSHIFT | S/N |
| 0 | 07540013 | 0.475789 | 0.00000 | 19.0122 | 07540011 | 0.00000 | 0.475789 | 19.0016 |
| 1 | 07540017 | 0.475239 | 0.000550002 | 19.0958 | 07540015 | 2.24179e-05 | 0.475767 | 19.0316 |
| 2 | 07540016 | 0.474781 | 0.00100800 | 19.0670 | 07540014 | -0.000498776 | 0.476288 | 19.0250 |
| 3 | 07540012 | 0.475454 | 0.000335008 | 19.0211 | 07540018 | 0.00381613 | 0.471973 | 19.0155 |