| Red | Green | Blue | |
| z | 17.64 | ||
| znorm | Inf | ||
| sky | -Inf | -Inf | -Inf |
| S/N | 21.6 | 36.6 | 38.4 |
| S/N(c) | 0.0 | 0.0 | 0.0 |
| SN(E/C) |
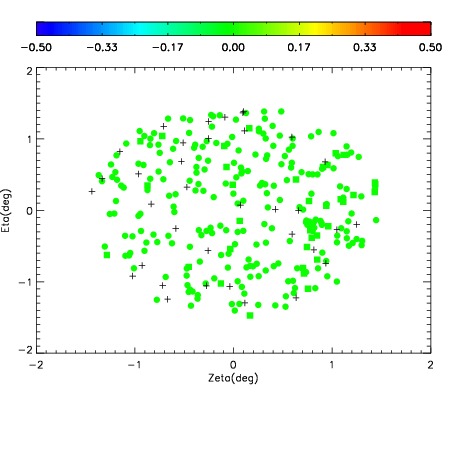
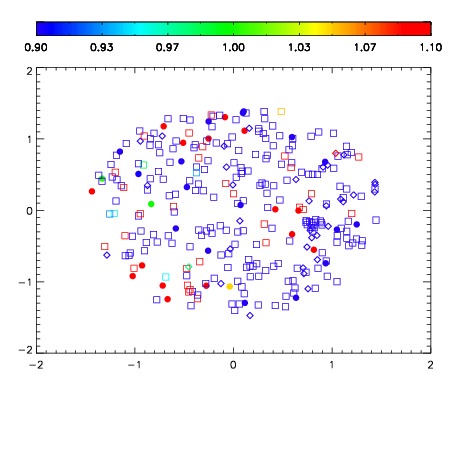
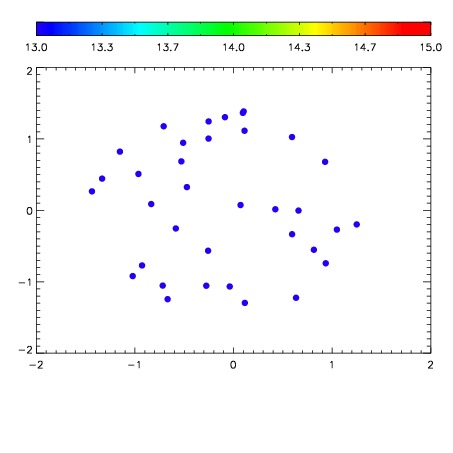

| Frame | Nreads | Zeropoints | Mag plots | Spatial mag deviation | Spatial sky 16325A emission deviations (filled: sky, open: star) | Spatial sky continuum emission | Spatial sky telluric CO2 absorption deviations (filled: H < 10) | |||||||||||||||||||||||
| 0 | 0 |
|
|
|
|
|
|
| IPAIR | NAME | SHIFT | NEWSHIFT | S/N | NAME | SHIFT | NEWSHIFT | S/N |
| 0 | 09990066 | 0.473308 | 0.00000 | 18.6769 | 09990068 | 0.00171150 | 0.471597 | 18.5286 |
| 1 | 09990070 | 0.471948 | 0.00136000 | 19.1390 | 09990067 | 0.000749850 | 0.472558 | 19.1448 |
| 2 | 09990069 | 0.472566 | 0.000741988 | 18.6856 | 09990071 | 0.00251122 | 0.470797 | 19.1214 |