| Red | Green | Blue | |
| z | 17.64 | ||
| znorm | Inf | ||
| sky | -Inf | -Inf | -Inf |
| S/N | 32.5 | 54.8 | 58.1 |
| S/N(c) | 0.0 | 0.0 | 0.0 |
| SN(E/C) |
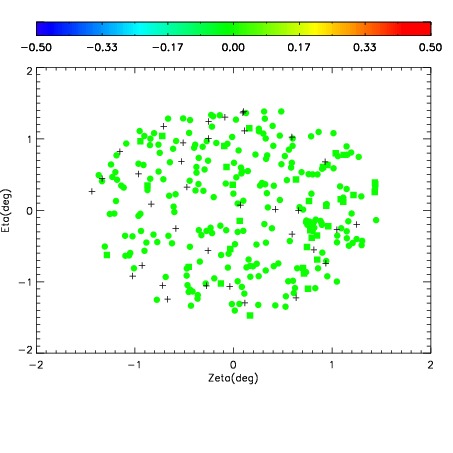
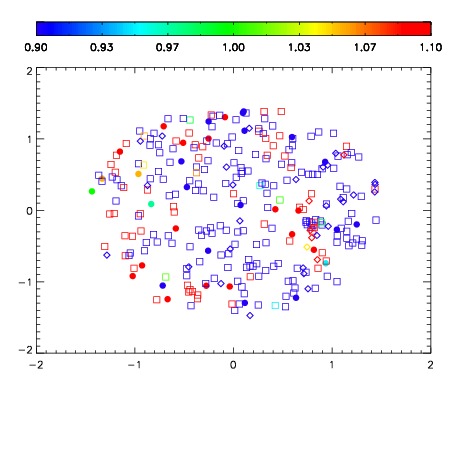
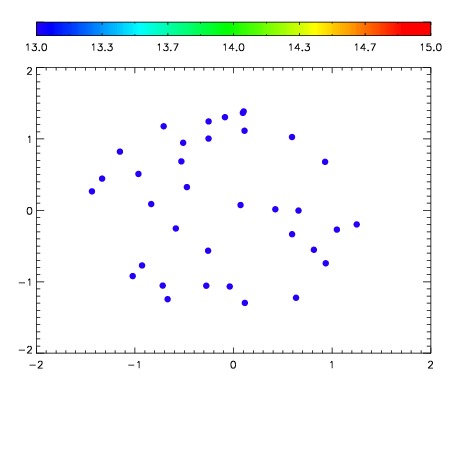

| Frame | Nreads | Zeropoints | Mag plots | Spatial mag deviation | Spatial sky 16325A emission deviations (filled: sky, open: star) | Spatial sky continuum emission | Spatial sky telluric CO2 absorption deviations (filled: H < 10) | |||||||||||||||||||||||
| 0 | 0 |
|
|
|
|
|
|
| IPAIR | NAME | SHIFT | NEWSHIFT | S/N | NAME | SHIFT | NEWSHIFT | S/N |
| 0 | 10220074 | 0.493929 | 0.00000 | 19.1356 | 10220079 | -0.00144473 | 0.495374 | 19.1306 |
| 1 | 10220077 | 0.492916 | 0.00101301 | 19.1523 | 10220076 | -0.000654634 | 0.494584 | 19.1425 |
| 2 | 10220081 | 0.491901 | 0.00202799 | 19.1459 | 10220075 | -0.000172529 | 0.494102 | 19.1352 |
| 3 | 10220078 | 0.493453 | 0.000476003 | 19.1222 | 10220080 | -0.00162314 | 0.495552 | 19.1136 |
| 4 | 10220073 | 0.493597 | 0.000331998 | 19.1072 | 10220072 | 0.00000 | 0.493929 | 19.0958 |