| Red | Green | Blue | |
| z | 17.63 | ||
| znorm | Inf | ||
| sky | -Inf | -NaN | -Inf |
| S/N | 17.4 | 31.4 | 33.3 |
| S/N(c) | 0.0 | 0.0 | 0.0 |
| SN(E/C) |
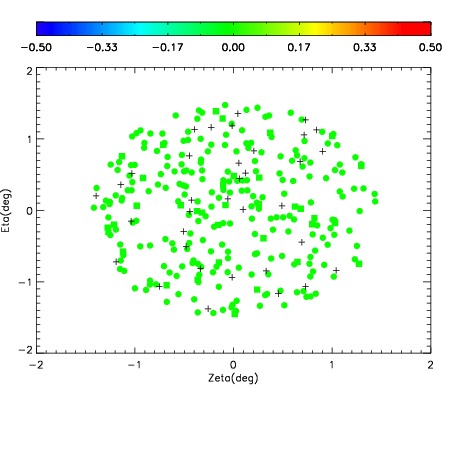
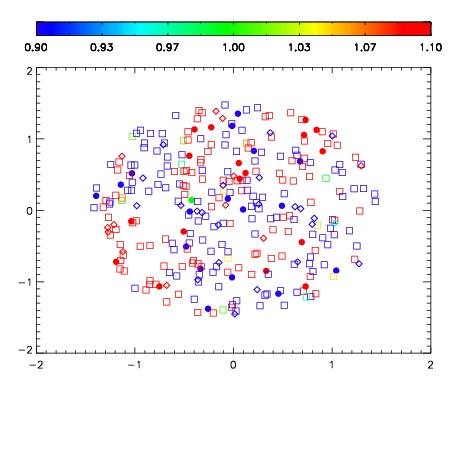
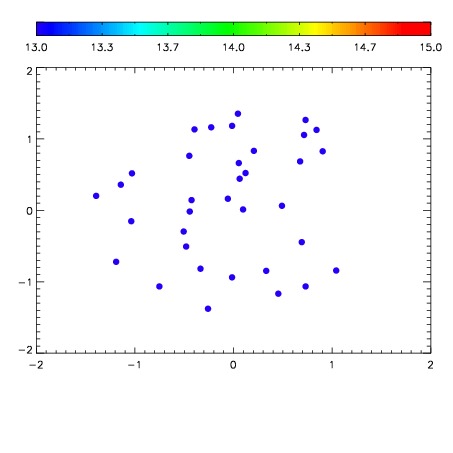

| Frame | Nreads | Zeropoints | Mag plots | Spatial mag deviation | Spatial sky 16325A emission deviations (filled: sky, open: star) | Spatial sky continuum emission | Spatial sky telluric CO2 absorption deviations (filled: H < 10) | |||||||||||||||||||||||
| 0 | 0 |
|
|
|
|
|
|
| IPAIR | NAME | SHIFT | NEWSHIFT | S/N | NAME | SHIFT | NEWSHIFT | S/N |
| 0 | 03790016 | 0.507371 | 0.00000 | 19.1612 | 03790010 | 0.00000 | 0.507371 | 18.6144 |
| 1 | 03790012 | 0.505368 | 0.00200301 | 18.4886 | 03790014 | 0.000178766 | 0.507192 | 18.3187 |
| 2 | 03790011 | 0.505224 | 0.00214702 | 18.4153 | 03790017 | 0.00316283 | 0.504208 | 18.2547 |
| 3 | 03790015 | 0.506868 | 0.000503004 | 18.1697 | 03790013 | 0.00158799 | 0.505783 | 17.1159 |