| Red | Green | Blue | |
| z | 17.64 | ||
| znorm | Inf | ||
| sky | -Inf | -NaN | -Inf |
| S/N | 30.1 | 49.8 | 54.2 |
| S/N(c) | 0.0 | 0.0 | 0.0 |
| SN(E/C) |
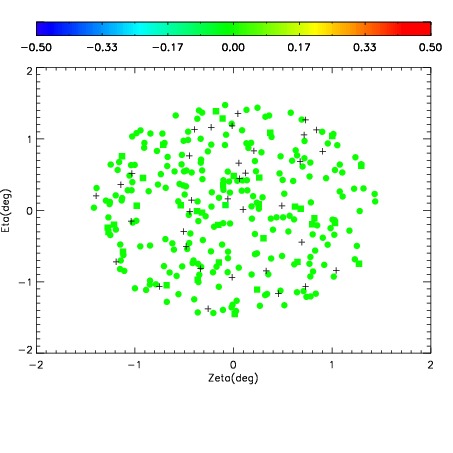
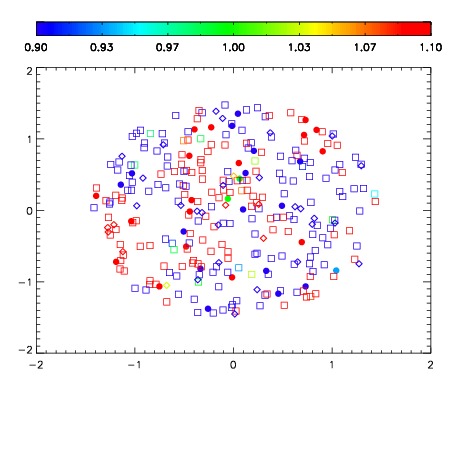
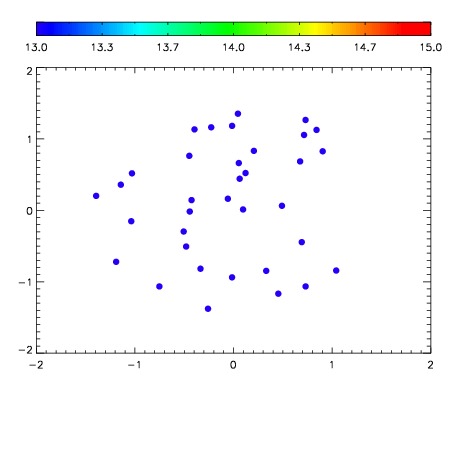

| Frame | Nreads | Zeropoints | Mag plots | Spatial mag deviation | Spatial sky 16325A emission deviations (filled: sky, open: star) | Spatial sky continuum emission | Spatial sky telluric CO2 absorption deviations (filled: H < 10) | |||||||||||||||||||||||
| 0 | 0 |
|
|
|
|
|
|
| IPAIR | NAME | SHIFT | NEWSHIFT | S/N | NAME | SHIFT | NEWSHIFT | S/N |
| 0 | 04060016 | 0.505243 | 0.00000 | 19.1395 | 04060014 | 0.00155769 | 0.503685 | 19.1167 |
| 1 | 04060012 | 0.500422 | 0.00482100 | 19.1548 | 04060017 | 0.00259321 | 0.502650 | 19.1557 |
| 2 | 04060011 | 0.499427 | 0.00581601 | 19.1536 | 04060013 | 0.000192810 | 0.505050 | 19.1544 |
| 3 | 04060015 | 0.503722 | 0.00152099 | 19.1211 | 04060010 | 0.00000 | 0.505243 | 19.0963 |