| Red | Green | Blue | |
| z | 17.64 | ||
| znorm | Inf | ||
| sky | -NaN | -NaN | -Inf |
| S/N | 21.0 | 38.6 | 40.1 |
| S/N(c) | 0.0 | 0.0 | 0.0 |
| SN(E/C) |
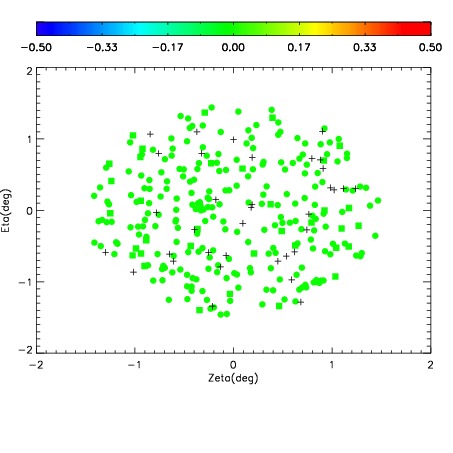
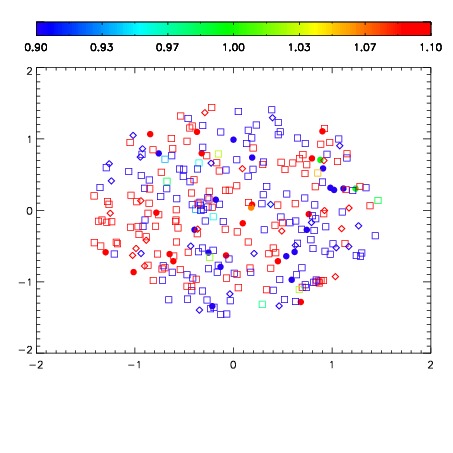
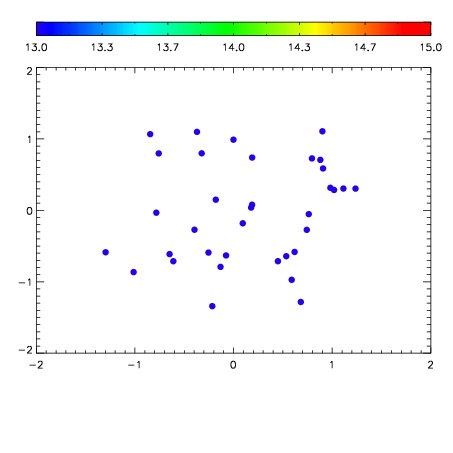

| Frame | Nreads | Zeropoints | Mag plots | Spatial mag deviation | Spatial sky 16325A emission deviations (filled: sky, open: star) | Spatial sky continuum emission | Spatial sky telluric CO2 absorption deviations (filled: H < 10) | |||||||||||||||||||||||
| 0 | 0 |
|
|
|
|
|
|
| IPAIR | NAME | SHIFT | NEWSHIFT | S/N | NAME | SHIFT | NEWSHIFT | S/N |
| 0 | 10890080 | 0.510766 | 0.00000 | 18.5707 | 10890077 | -0.00205634 | 0.512822 | 18.6421 |
| 1 | 10890076 | 0.507141 | 0.00362504 | 18.6666 | 10890081 | 0.000631510 | 0.510135 | 18.7015 |
| 2 | 10890075 | 0.506453 | 0.00431305 | 18.5518 | 10890074 | -0.00202006 | 0.512786 | 18.5532 |
| 3 | 10890072 | 0.508820 | 0.00194603 | 18.4080 | 10890073 | -0.00153684 | 0.512303 | 18.5092 |
| 4 | 10890071 | 0.508632 | 0.00213403 | 18.2378 | 10890078 | -0.00217173 | 0.512938 | 18.3851 |
| 5 | 10890079 | 0.509413 | 0.00135303 | 18.2376 | 10890070 | 0.00000 | 0.510766 | 17.8510 |