| Red | Green | Blue | |
| z | 17.64 | ||
| znorm | Inf | ||
| sky | -NaN | -NaN | -Inf |
| S/N | 19.5 | 34.8 | 36.0 |
| S/N(c) | 0.0 | 0.0 | 0.0 |
| SN(E/C) |
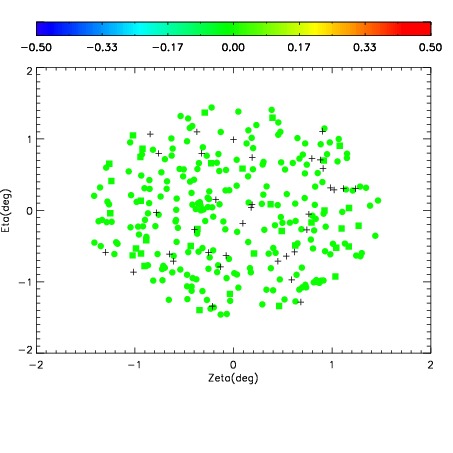
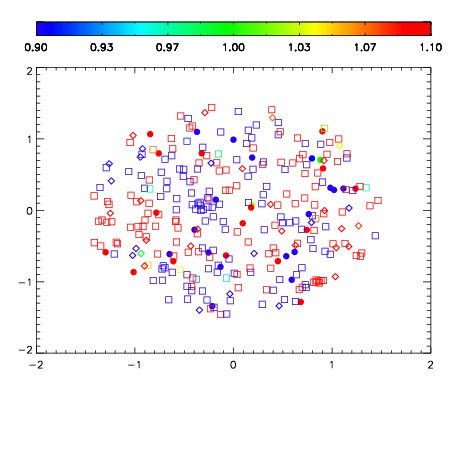
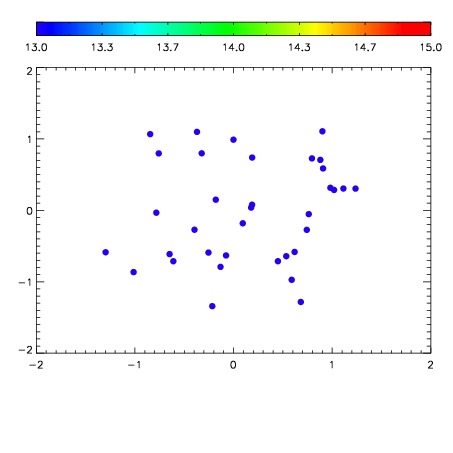

| Frame | Nreads | Zeropoints | Mag plots | Spatial mag deviation | Spatial sky 16325A emission deviations (filled: sky, open: star) | Spatial sky continuum emission | Spatial sky telluric CO2 absorption deviations (filled: H < 10) | |||||||||||||||||||||||
| 0 | 0 |
|
|
|
|
|
|
| IPAIR | NAME | SHIFT | NEWSHIFT | S/N | NAME | SHIFT | NEWSHIFT | S/N |
| 0 | 11060069 | 0.482181 | 0.00000 | 18.7511 | 11060070 | 0.000994578 | 0.481186 | 18.8183 |
| 1 | 11060068 | 0.481529 | 0.000652015 | 18.7372 | 11060067 | -0.00230843 | 0.484489 | 18.6396 |
| 2 | 11060064 | 0.481068 | 0.00111303 | 18.5485 | 11060063 | 0.00000 | 0.482181 | 18.5918 |
| 3 | 11060065 | 0.481563 | 0.000618011 | 18.3160 | 11060066 | -0.00217031 | 0.484351 | 18.5887 |