| Red | Green | Blue | |
| z | 17.64 | ||
| znorm | Inf | ||
| sky | -Inf | -NaN | -Inf |
| S/N | 21.5 | 37.4 | 40.8 |
| S/N(c) | 0.0 | 0.0 | 0.0 |
| SN(E/C) |

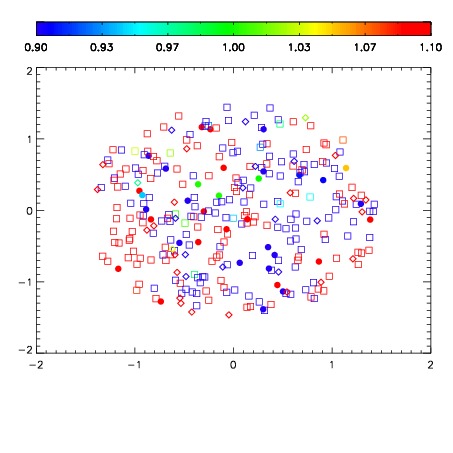
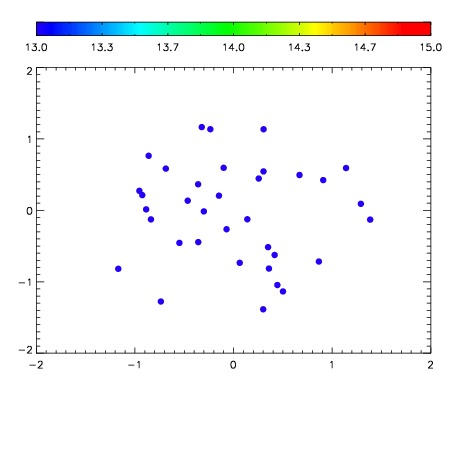

| Frame | Nreads | Zeropoints | Mag plots | Spatial mag deviation | Spatial sky 16325A emission deviations (filled: sky, open: star) | Spatial sky continuum emission | Spatial sky telluric CO2 absorption deviations (filled: H < 10) | |||||||||||||||||||||||
| 0 | 0 |
|
|
|
|
|
|
| IPAIR | NAME | SHIFT | NEWSHIFT | S/N | NAME | SHIFT | NEWSHIFT | S/N |
| 0 | 08140017 | 0.509363 | 0.00000 | 18.5986 | 08140011 | 0.00000 | 0.509363 | 18.5710 |
| 1 | 08140013 | 0.507533 | 0.00182998 | 18.8423 | 08140015 | -0.00481228 | 0.514175 | 18.8117 |
| 2 | 08140016 | 0.507622 | 0.00174099 | 18.7244 | 08140014 | -0.00226365 | 0.511627 | 18.7869 |
| 3 | 08140012 | 0.506488 | 0.00287497 | 18.7021 | 08140018 | -0.00150432 | 0.510867 | 18.7452 |