| Red | Green | Blue | |
| z | 17.64 | ||
| znorm | Inf | ||
| sky | -Inf | -Inf | -Inf |
| S/N | 25.2 | 44.3 | 46.5 |
| S/N(c) | 0.0 | 0.0 | 0.0 |
| SN(E/C) |
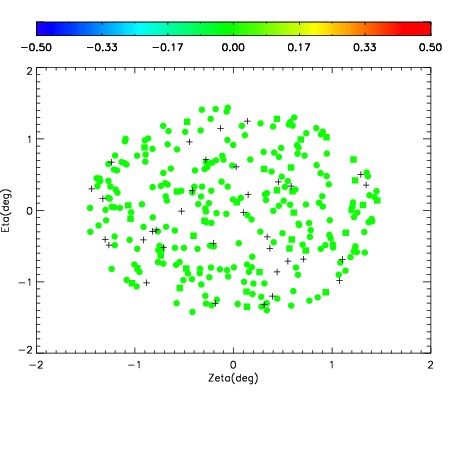
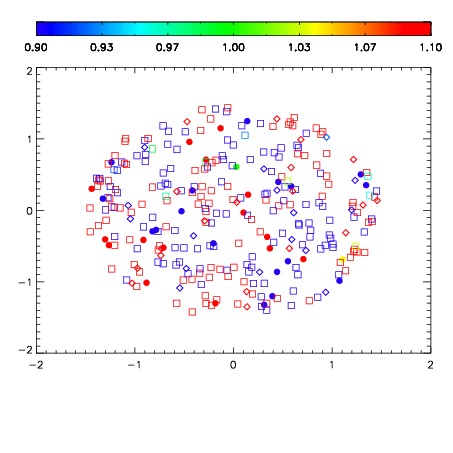


| Frame | Nreads | Zeropoints | Mag plots | Spatial mag deviation | Spatial sky 16325A emission deviations (filled: sky, open: star) | Spatial sky continuum emission | Spatial sky telluric CO2 absorption deviations (filled: H < 10) | |||||||||||||||||||||||
| 0 | 0 |
|
|
|
|
|
|
| IPAIR | NAME | SHIFT | NEWSHIFT | S/N | NAME | SHIFT | NEWSHIFT | S/N |
| 0 | 06670098 | 0.489185 | 0.00000 | 18.9259 | 06670100 | 0.00200919 | 0.487176 | 18.9291 |
| 1 | 06670101 | 0.488766 | 0.000418991 | 18.8927 | 06670099 | 0.00424766 | 0.484937 | 18.8803 |
| 2 | 06670097 | 0.488285 | 0.000900000 | 18.8611 | 06670096 | 0.000913304 | 0.488272 | 18.7422 |
| 3 | 06670094 | 0.486939 | 0.00224599 | 18.7264 | 06670095 | 0.00216345 | 0.487022 | 18.7321 |
| 4 | 06670093 | 0.486798 | 0.00238702 | 18.6735 | 06670092 | 0.00000 | 0.489185 | 18.6122 |