| Red | Green | Blue | |
| z | 17.64 | ||
| znorm | Inf | ||
| sky | -Inf | -NaN | -Inf |
| S/N | 25.6 | 44.1 | 46.8 |
| S/N(c) | 0.0 | 0.0 | 0.0 |
| SN(E/C) |

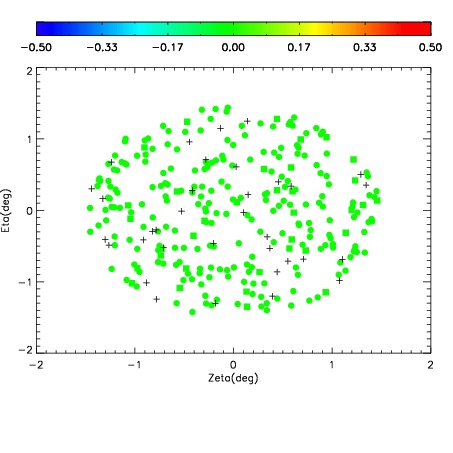
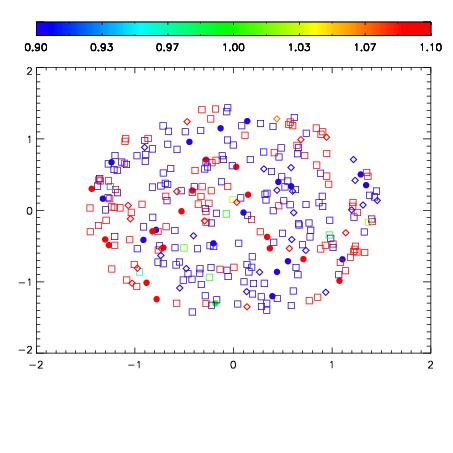
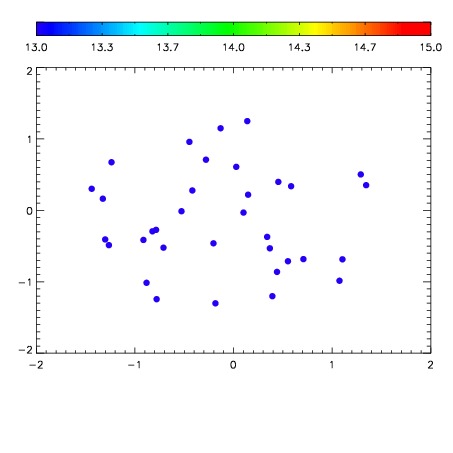

| Frame | Nreads | Zeropoints | Mag plots | Spatial mag deviation | Spatial sky 16325A emission deviations (filled: sky, open: star) | Spatial sky continuum emission | Spatial sky telluric CO2 absorption deviations (filled: H < 10) | |||||||||||||||||||||||
| 0 | 0 |
|
|
|
|
|
|
| IPAIR | NAME | SHIFT | NEWSHIFT | S/N | NAME | SHIFT | NEWSHIFT | S/N |
| 0 | 06930090 | 0.495830 | 0.00000 | 19.1331 | 06930087 | -0.000555053 | 0.496385 | 19.1576 |
| 1 | 06930089 | 0.495513 | 0.000317007 | 19.1136 | 06930088 | -0.000346272 | 0.496176 | 19.1204 |
| 2 | 06930086 | 0.493147 | 0.00268301 | 19.0934 | 06930091 | 0.000976630 | 0.494853 | 19.1030 |
| 3 | 06930085 | 0.493171 | 0.00265899 | 19.0506 | 06930084 | 0.00000 | 0.495830 | 19.0265 |