| Red | Green | Blue | |
| z | 17.64 | ||
| znorm | Inf | ||
| sky | -NaN | -Inf | -Inf |
| S/N | 23.0 | 40.3 | 43.6 |
| S/N(c) | 0.0 | 0.0 | 0.0 |
| SN(E/C) |
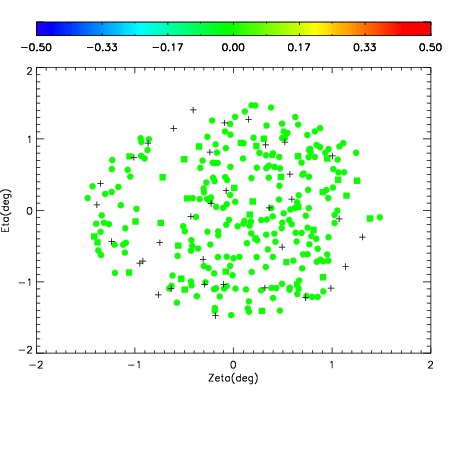
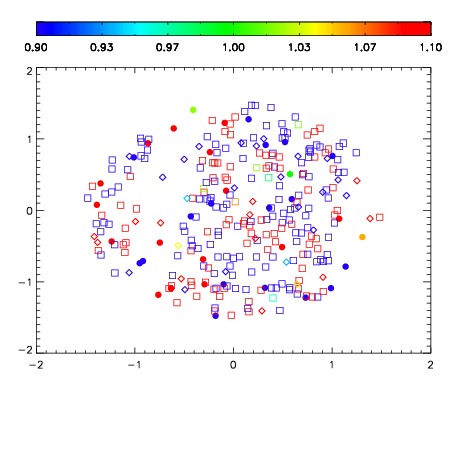
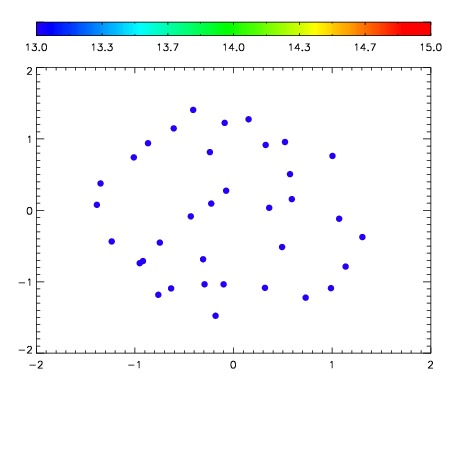

| Frame | Nreads | Zeropoints | Mag plots | Spatial mag deviation | Spatial sky 16325A emission deviations (filled: sky, open: star) | Spatial sky continuum emission | Spatial sky telluric CO2 absorption deviations (filled: H < 10) | |||||||||||||||||||||||
| 0 | 0 |
|
|
|
|
|
|
| IPAIR | NAME | SHIFT | NEWSHIFT | S/N | NAME | SHIFT | NEWSHIFT | S/N |
| 0 | 03690073 | 0.497329 | 0.00000 | 18.8638 | 03690075 | 0.000996511 | 0.496332 | 18.9253 |
| 1 | 03690068 | 0.492434 | 0.00489500 | 19.0415 | 03690070 | 0.00514906 | 0.492180 | 19.0156 |
| 2 | 03690069 | 0.496016 | 0.00131300 | 19.0094 | 03690067 | 0.00000 | 0.497329 | 19.0121 |
| 3 | 03690072 | 0.495870 | 0.00145900 | 18.8317 | 03690071 | 0.00473347 | 0.492596 | 18.9037 |