| Red | Green | Blue | |
| z | 17.64 | ||
| znorm | Inf | ||
| sky | -Inf | -Inf | -Inf |
| S/N | 27.6 | 46.2 | 50.1 |
| S/N(c) | 0.0 | 0.0 | 0.0 |
| SN(E/C) |
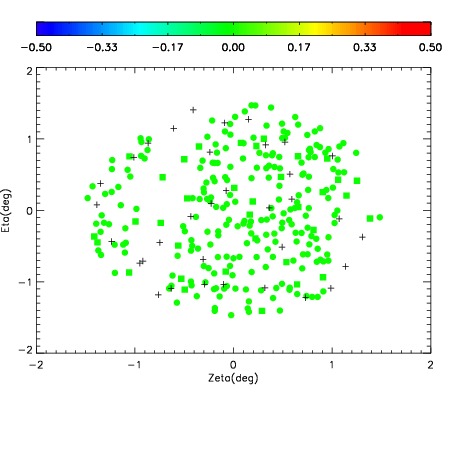
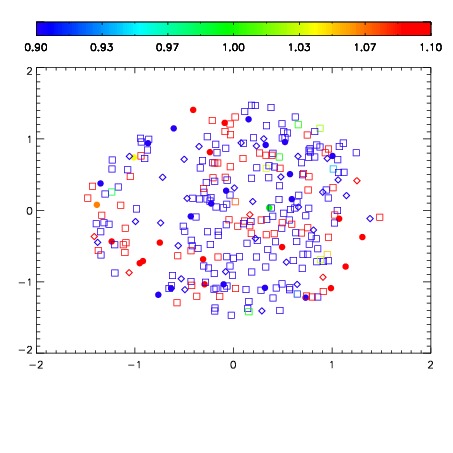
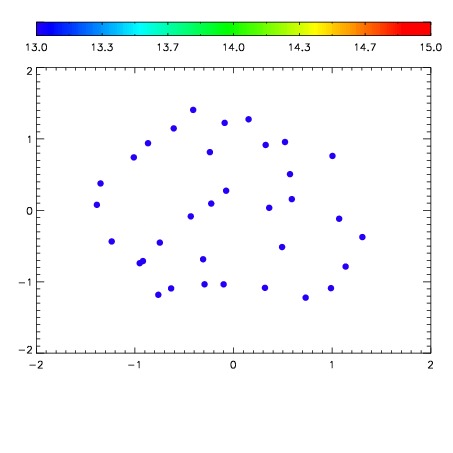

| Frame | Nreads | Zeropoints | Mag plots | Spatial mag deviation | Spatial sky 16325A emission deviations (filled: sky, open: star) | Spatial sky continuum emission | Spatial sky telluric CO2 absorption deviations (filled: H < 10) | |||||||||||||||||||||||
| 0 | 0 |
|
|
|
|
|
|
| IPAIR | NAME | SHIFT | NEWSHIFT | S/N | NAME | SHIFT | NEWSHIFT | S/N |
| 0 | 03710082 | 0.510222 | 0.00000 | 19.0849 | 03710083 | 0.00423658 | 0.505985 | 19.1123 |
| 1 | 03710077 | 0.505437 | 0.00478500 | 19.1860 | 03710076 | 0.00000 | 0.510222 | 19.2038 |
| 2 | 03710081 | 0.508059 | 0.00216299 | 19.1736 | 03710080 | 0.00284875 | 0.507373 | 19.1793 |
| 3 | 03710078 | 0.506263 | 0.00395900 | 19.1697 | 03710079 | 0.00231934 | 0.507903 | 19.1621 |