| Red | Green | Blue | |
| z | 17.64 | ||
| znorm | Inf | ||
| sky | -Inf | -Inf | -Inf |
| S/N | 28.6 | 46.6 | 52.2 |
| S/N(c) | 0.0 | 0.0 | 0.0 |
| SN(E/C) |
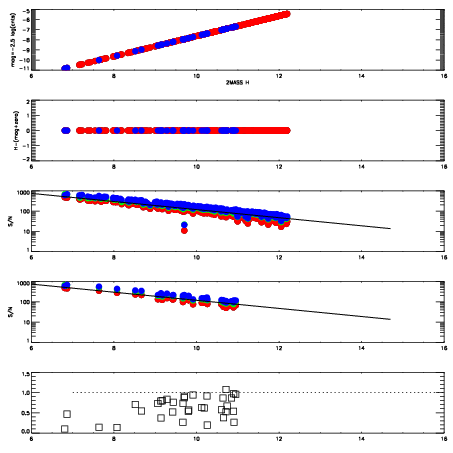
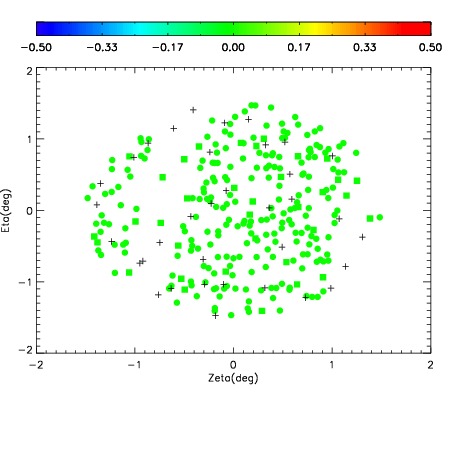

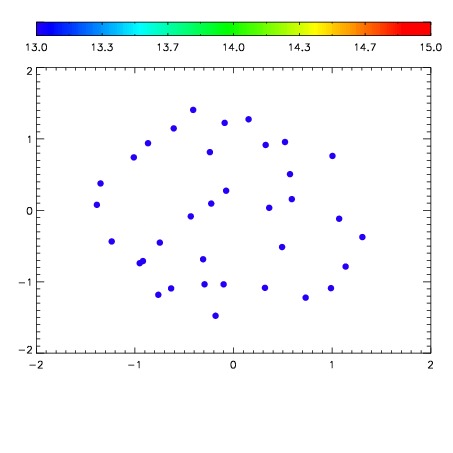

| Frame | Nreads | Zeropoints | Mag plots | Spatial mag deviation | Spatial sky 16325A emission deviations (filled: sky, open: star) | Spatial sky continuum emission | Spatial sky telluric CO2 absorption deviations (filled: H < 10) | |||||||||||||||||||||||
| 0 | 0 |
|
|
|
|
|
|
| IPAIR | NAME | SHIFT | NEWSHIFT | S/N | NAME | SHIFT | NEWSHIFT | S/N |
| 0 | 04040053 | 0.495899 | 0.00000 | 19.1734 | 04040047 | 0.00000 | 0.495899 | 19.1421 |
| 1 | 04040048 | 0.493067 | 0.00283200 | 19.1958 | 04040051 | -0.00160397 | 0.497503 | 19.1985 |
| 2 | 04040049 | 0.493025 | 0.00287399 | 19.1851 | 04040050 | -0.000292001 | 0.496191 | 19.1912 |
| 3 | 04040052 | 0.495075 | 0.000824004 | 19.1767 | 04040054 | -0.00180241 | 0.497701 | 19.1816 |