| Red | Green | Blue | |
| z | 17.64 | ||
| znorm | Inf | ||
| sky | -Inf | -Inf | -Inf |
| S/N | 27.8 | 45.9 | 49.1 |
| S/N(c) | 0.0 | 0.0 | 0.0 |
| SN(E/C) |
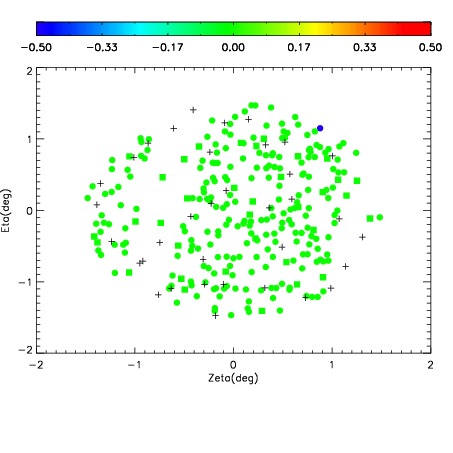
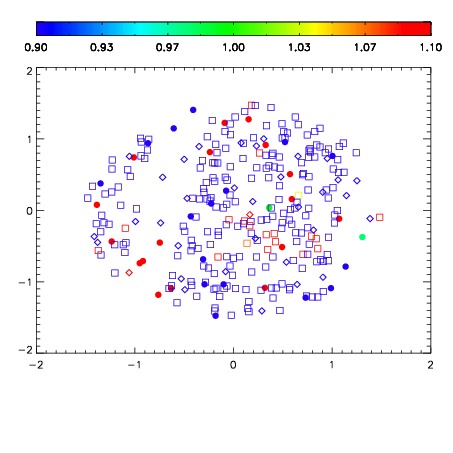
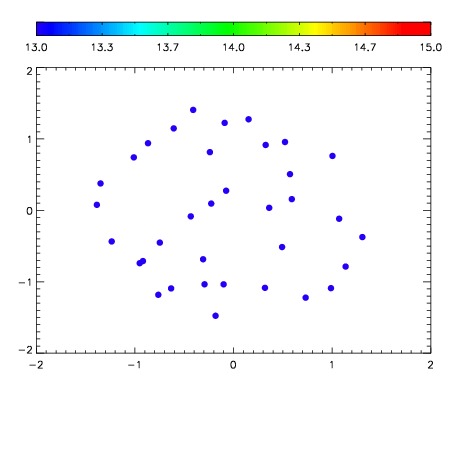

| Frame | Nreads | Zeropoints | Mag plots | Spatial mag deviation | Spatial sky 16325A emission deviations (filled: sky, open: star) | Spatial sky continuum emission | Spatial sky telluric CO2 absorption deviations (filled: H < 10) | |||||||||||||||||||||||
| 0 | 0 |
|
|
|
|
|
|
| IPAIR | NAME | SHIFT | NEWSHIFT | S/N | NAME | SHIFT | NEWSHIFT | S/N |
| 0 | 04060031 | 0.494417 | 0.00000 | 19.1202 | 04060030 | -0.00117512 | 0.495592 | 19.1355 |
| 1 | 04060028 | 0.493498 | 0.000919014 | 19.1675 | 04060029 | 0.000480933 | 0.493936 | 19.1487 |
| 2 | 04060027 | 0.492931 | 0.00148600 | 19.1117 | 04060033 | 0.000984168 | 0.493433 | 19.1191 |
| 3 | 04060032 | 0.493893 | 0.000524014 | 19.0781 | 04060026 | 0.00000 | 0.494417 | 19.0840 |